The Shadow Banking System: How Big Is It?

A recent article in the Financial Times discussed about The Shadow Banking System in the U.S. based on a report by the Federal Reserve Bank of New York.

One of the charts in the report depicts the modern day shadow banking system in detail. The author of FT report Gillian Tett notes that the shadow banking system is extremely complex and remains mysterious to regulators, investors and politicians. At $20 Trillions, it is also double the size of the traditional banking system.

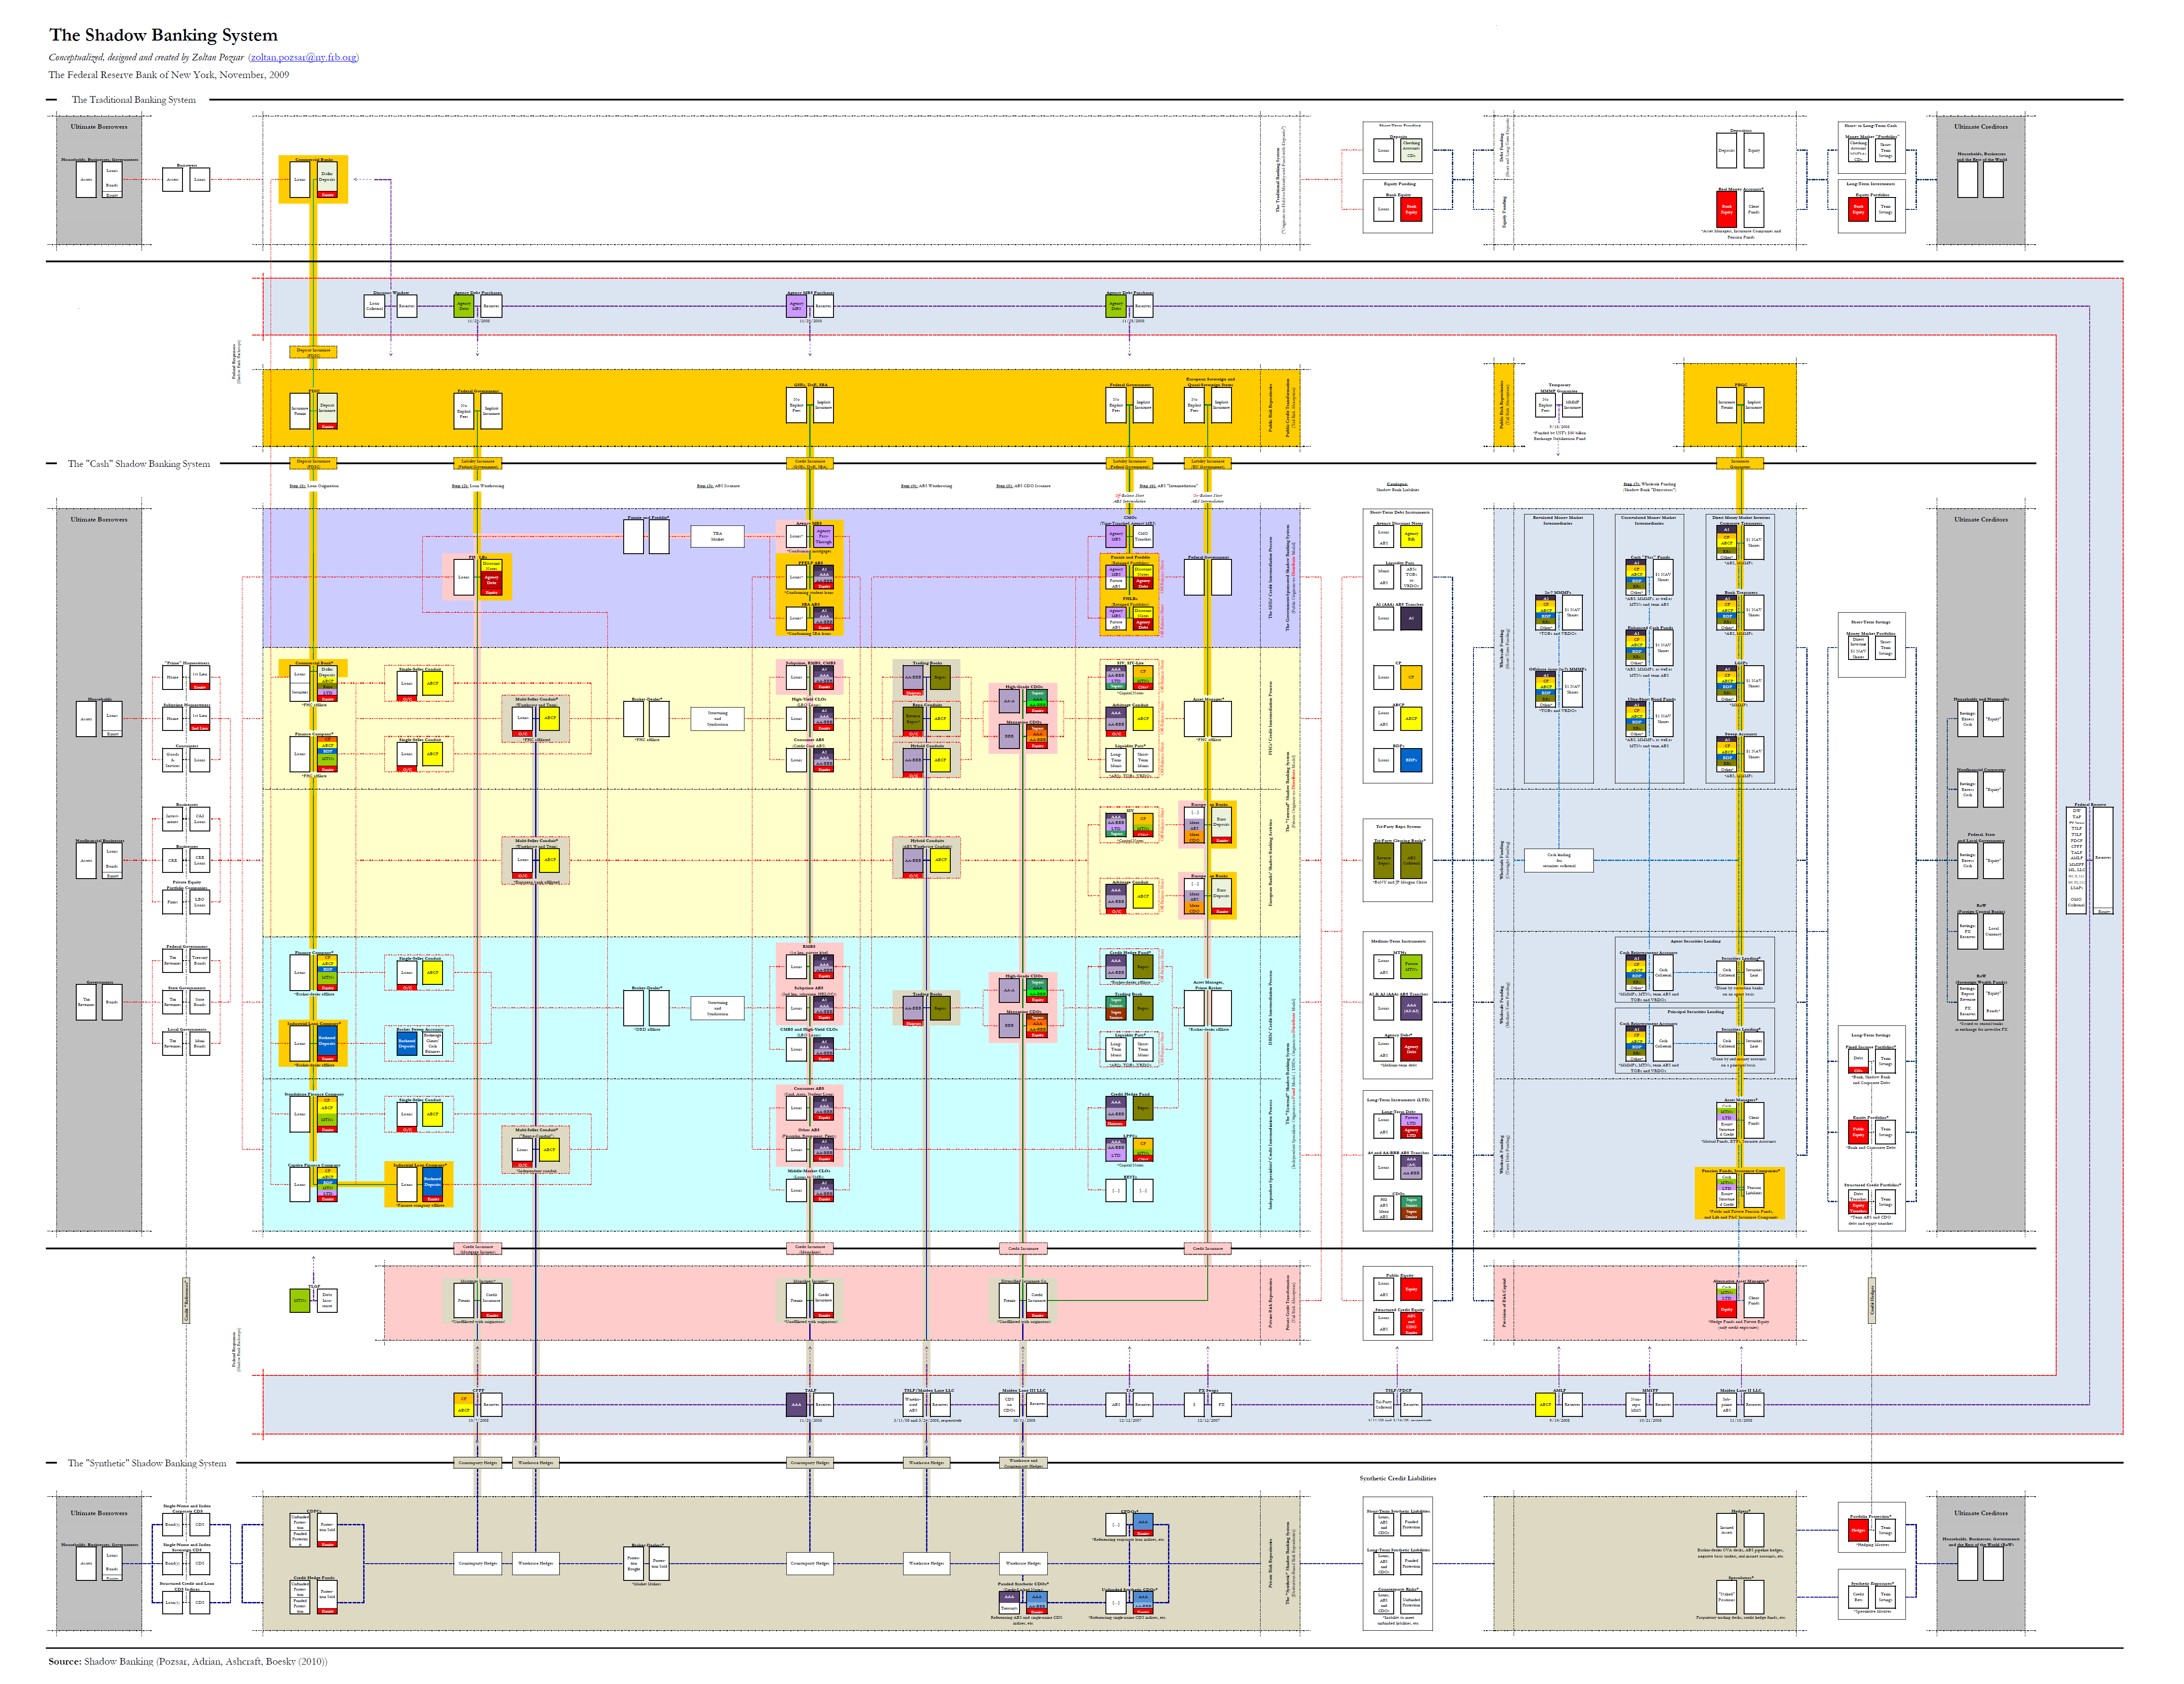
The graphic below represents The Shadow Banking System:

Click to enlarge (This is a large size picture)

Small-Shadow-banking-System-USA

The Growth of Shadow Banking System:

shadow-banking-system-growth.png

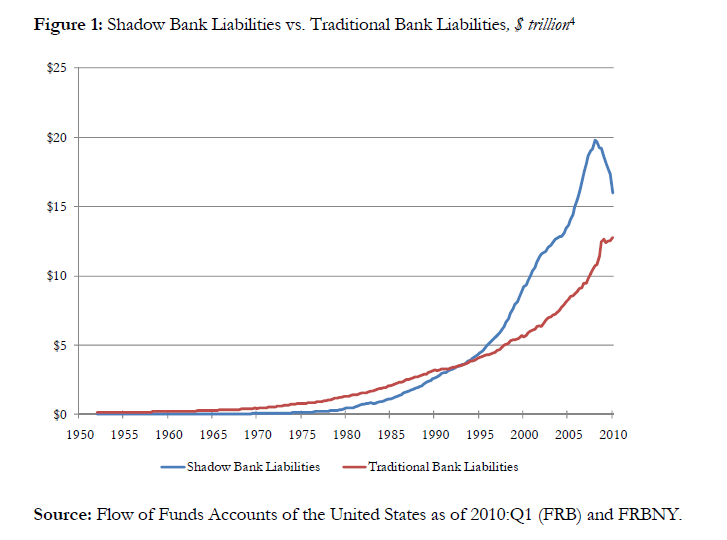
Source:  Shadow Banking,  Federal Reserve bank of New York

From the FT article:

“For one thing, this circuit board is a reminder of how clueless most investors, regulators and rating agencies were before 2007 about finance. After all, during the credit boom, there was plenty of research being conducted into the financial world; but I never saw anything remotely comparable to this road map.That was a striking, terrible omission. The Fed now estimates that in early 2008 shadow banking was $20,000bn in size, dwarfing the $11,000bn traditional banking system. And though this shadow system has now shrunk to a “mere” $16,000bn, this remains bigger than traditional banking, at some $13,000bn. Little wonder, then, that so few people immediately appreciated the significance of the seizing up of shadow banking in 2007.

But secondly, this poster is also a reminder that many things about the modern financial system remain mysterious – even today. On the edges of the circuit board, the NY Fed economists list all the government programmes that have supported the system since 2007 (and, in effect, replaced shadow banks when they suffered runs). This “shadow, shadow bank system” – as it might be called – looks complex and baffling too. And in practical terms, the sheer breadth and complexity of that box makes it hard to know what will happen if – or when – government aid disappears.”

It can be argued that one of the causes of the financial crisis is the size and the mind-boggling complexity of this shadow banking system that exists today completely unregulated.

The Largest 50 German Companies by Sales

Germany celebrated the 20th anniversary of unification on Oct 3, 2010. Bloomberg BusinessWeek commemorated the event with a special report titled “The Best Merger Ever“. Indeed the unification of the former East Germany with West Germany helped make the country one of the top economies in the world.

brandenburg-gate.jpgToday Germany is the most important country in Europe and its export-driven economic model is the envy of the developed world. In 2005, the 10-year growth rate and unemployment rate were much worse than that of the U.S. But now Germany is growing faster than the U.S. and its unemployment rate of 7.6% in August is lower than the 9.6% in the U.S. The German economy is the largest in Europe with a GDP of $3.23 Trillion.Compared to Germany, Iceland, which went thru a banking crisis in 2008, has a GDP of just $12 billion. The GDP of Greece is about $333 billion and Ireland is about $172 billion. In Germany, the Mittelstand companies (small and medium-size firms) with fewer than 500 employees comprise more than 50% of the German workforce and contribute about half of the GDP. According to the Businessweek report, these Mittelstand companies survived the credit crisis well and have now emerged as successful models in the era of globalization.

Many German companies are world-class leaders in their respective industries. Some of these top firms such as Adidas, Allianz, BASF, BMW, SAP, Siemens, etc. are recognized worldwide and are constituents of the DAX index. Despite the ongoing Irish sovereign debt crisis and its impact on the Euro, there are many reasons to invest in Germany. An investor looking to gain some exposure to German equities may want to review some of the large German companies.

The largest 50 German firms based on sales in the last 12 months prior to October 2010 are listed below:

[TABLE=700]

Source: Bloomberg BusinessWeek

As most of the companies shown above do not trade on the organized US exchanges, a simple and easy way to invest in them is via the iShares Germany ETF (EWG). The portfolio contains most of the 50 companies. The fund has an asset base of about $1.8 billion and the expense ratio is 0.55%. Another way to invest in these companies is to add some of the ADRs listed or invest in their locally listed shares on the Frankfurt stock exchange if one has access to that exchange.

Individual Stocks Are Better Than ETFs for Investing in Foreign Utilities

ETFs and individual stocks are two ways to gain gain exposure to foreign utilities. However ETFs may not be necessarily the best way in foreign utilities. In this post lets why individual stocks may be better than going with the ETFs available in the market.

The three ETFs available to invest in foreign utilities are:

  1. iShares S&P Global Utilities Sector Index Fund  (JXI)
  2. WisdomTree International Utilities Sector Fund  (DBU)
  3. SPDR S&P International Utilities Sector Fund  (IPU)

The SPDR S&P International Utilities Sector Fund has a small asset base of just $8.5 M. Hence I have left out this fund from the analysis.

The Top 10 holdings  of the iShares and WisdomTree funds are listed below with the current dividend yields of their US-listed depository receipts:

a) iShares S&P Global Utilities Sector Index Fund (JXI)

[TABLE=699]

b) WisdomTree International Utilities Sector Fund (DBU)

[TABLE=698]

The iShares ETF is the largest of the funds with total assets of $254M and an expense ratio of 0.48%.  This fund tracks the S&P Global Utilities Index. The U.S. accounts for about 40% of the portfolio. So the disadvantage with this fund is that it does not invest purely in foreign utilities. The 30-day SEC Yield is 3.81%.In terms of performance, JXI is down 3.49% as of September end, 2010. The annual total returns for 2007, 2008 and 2009 were 22.49%, -30.39% and 8.38% respectively. The table above shows that 8 out of the 10 holdings in the portfolio have dividend yields higher than the 30-day SEC yield.Foreign stocks generally have high dividend yields than ETFs.

The WisdomTree ETF has total assets of $37M and the expense ratio is 0.58%. The  30-day SEC Yield is 4.18%.  This fund can be considered as a purely foreign focused fund since U.S. utilities for just about 1% of the total portfolio. France, Germany, UK, Italy and Spain account for more than 60% of the allocation. Similar to the iShares fund, 8 out of the 10 holdings have yields higher than the 30-day SEC yield. The annual total returns for 2007, 2008 and 2009 were 23.28%, -29.24% and 1.26% respectively. YTD the share price is down about 4%.

In addition to dividend yield factor, despite having “global” and “international” in their names, the two ETFs do not offer exposure to emerging market utilities.Due to rising economic growth, power consumption in many emerging markets such as China, India, Brazil, etc. is growing exponentially.The iShares fund has about 1% of the fund allocated to the emerging market of Chile but that is a tiny portion of the emerging market universe. The WisdomTree fund is entirely devoted to dividend-paying utility firms in the developed markets outside of the U.S. and Canada. Because these ETFs do not invest in emerging market utilities they miss out on the great growth occurring in emerging markets. For example, the demand for electricity in Brazil is growing twice as fast as the U.S. India has the chronic problem of meeting its electricity demand. Recently the government there has embarked a on a program to drastically raise electricity output.

From an IAEA article on global electricity market trends:

power2peopletable1.gif

“World electricity demand is projected to double between 2000 and 2030, growing at an annual rate of 2.4% (see Table 1). This is faster than any other final energy source. Electricity’s share of total final energy consumption rises from 18% in 2000 to 22% in 2030. Electricity demand growth is strongest in developing countries, where demand will climb by over 4% per year over the projection period, more than tripling by 2030. Consequently, the developing countries’ share of global electricity demand jumps from 27% in 2000 to 43% in 2030.”

Many emerging market utility stocks offer excellent dividends and potential for capital appreciation. Brazilian electric utility Cemig (CIG), which is majority-owned by the Brazilian government, has a 4.75% dividend yield.  Some of the other emerging market electric utilities with high dividend yields include CPFL Energia (CPL) with 7.88%, Aes Tiete SA (AESAY) with 10.11%, Empresa Nacional de Electricidad SA (EOC) with 3.41% and Huaneng Power International (HNP) with 5.51%.

To be sure ETFs do have their own advantages such as offering  a simple and easy way to invest in foreign markets and achieve diversification. However that may not be the case in all ETFs. Also while investing in individual stocks can yield much higher returns than ETFs they may not be suitable for all investors as some of the stocks can be highly volatile especially those from emerging markets. Despite high yields, many EM utility stocks do not pay dividends consistently. However that is changing slowly as these firms try to attract more international capital and try to pay regular dividends.

The Top 20 Global Pharmaceutical Companies by Sales

The table below lists the top 20 global drug companies based on sales in 2009:

[TABLE=697]

Source: Contract Pharma

Otsuka, Gilead and Mylan are new to this list. Half of the companies ranked 11-20 are based in Japan. Though currently ranked at number 13, Israel-based Teva (TEVA), the world’s largest generic drug maker, has revenue goals that could propel it into the top 7 ranks in the next few years. US-based Gilead (GILD) primarily focuses on developing drugs for life-threatening diseases diseases such as HIV/AIDS, liver disease and serious cardiovascular/metabolic and respiratory conditions.

Related:

The Top 10 Global Biopharmaceutical Companies by Sales

How to Build a Simple Stock Portfolio for Retirement ?

I came across this interesting story at The Global and Mail site. From “The ‘blazingly simple,’ must-have portfolio:

“About 10 years ago, retired political science professor Mike Henderson singled out these companies for the essential roles they play in the Canadian economy. He then invested in each of them for the core of the retirement savings he and his wife would rely on. The cumulative average 10-year total return on these stocks (that’s share-price gains plus dividends) was 305 per cent, far better than the 72-per-cent gain for the S&P/TSX composite index.

Though he has a PhD from the London School of Economics, Mr. Henderson is no financial pro. Think of him as an informed amateur whose investing was influenced by his experience lecturing on the interaction of government and large corporations in Canada.

“The idea just came to me, and it was blazingly simple,” he said from his Toronto home. “I basically sat down and thought, what is absolutely essential to our society, and who provides those essentials?””

The chart below shows the 10-year performance of  Mr.Henderson’s stock picks against the S&P/TSX composite index:

Click to enlarge

chart-can-stocks.jpg

Please note that the returns shown are based on the TSX prices.

His seven picks were:

1. Railroads – Canadian National (CNI) & Canadian Pacific (CP)
2. Pipeline Operators – Enbridge (ENB), Fortis (FRTSF) and TransCanada (TRP)
3. Banks – TD Bank (TD) and Royal Bank of Canada (RY)

Two of the common features shared by the companies above are: All pay dividends and all are well established companies with a record of increasing dividend payments.