The Most and Least Corrupt Countries in the World

Corruption is not a problem only in emerging and under-developed countries. It is present in developed countries as well although it is relatively small. Some countries in the developed world have implemented certain policies that indirectly fosters corruption.

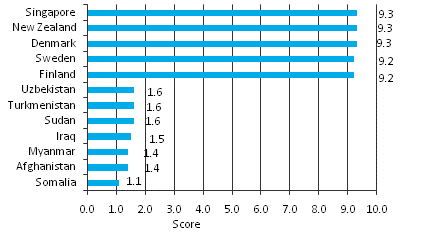
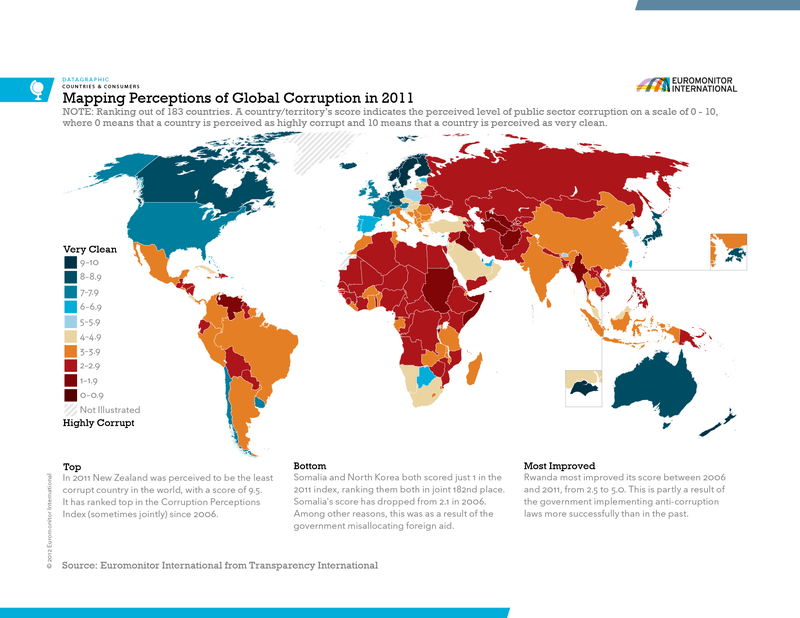
Transparency International’s 2010 Corruption Perceptions Index (CPI) measures the perceptions of corruption in the public sector.The index is created by using surveys and interviews in 178 countries. CPI scores range from 10(least corrupt)  to 1 (most corrupt).

The following graphic shows the mapping of the countries based on the Corruption Perception Index (CPI):

Click to enlarge
Source: Special Report: The Impact of Corruption, Euromonitor International

Some of the key findings in the Euromonitor report are:

  • New Zealand, Singapore and Denmark are the least corrupt countries in the world based on the CPI score.
  • The most corrupt countries are Somalia, Afghanistan, Myanmar, Iraq, Sudan, Turkmenistan and Uzbekistan.
  • Corruption affects the poorest section of a society the most.
  • Corruption in the developed world is sophisticated and include practices like campaign financing by corporations to influence policy, insider trading on stock markets, etc.
  • Certain developed countries are complicit in and benefit from corruption in the developing countries. Banking secrecy laws and favorable tax rules in Switzerland, the UK and Luxembourg facilitate the embezzlement of a nation’s wealth by corrupt elites in the developing world.
  • The U.S. is considered relatively incorrupt with a score of 7.1 on the CPI.
Canadian National vs.Canadian Pacific Railroad

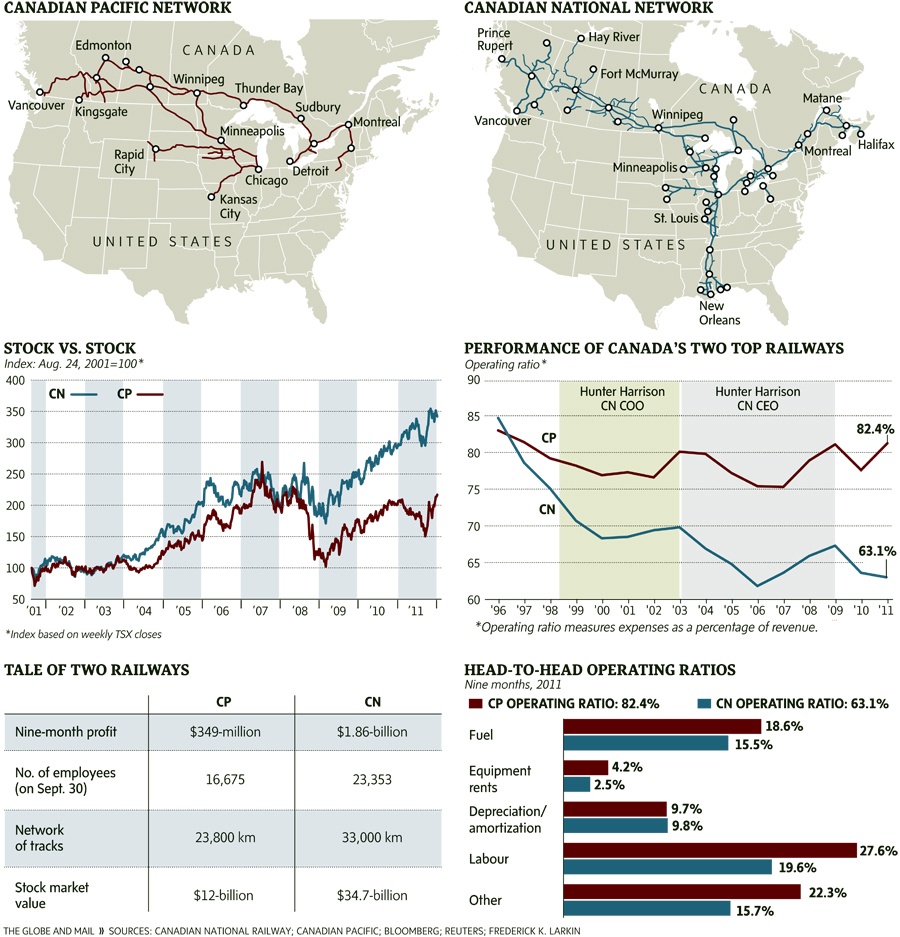
Canadian National Railway (CNI) and Canadian Pacific Railway (CP) are the major railroads in Canada. Activist investor Mr.Bill Ackman of hedge fund Pershing Square Capital Management has initiated a corporate battle to take control of the Canadian Pacific railroad and implement management changes. With a bet of $1.4 billion Mr.Bill currently holds 14.2% of the company. Promising ‘a nuclear winter’ if his demands are not met, the powerful hedge fund manager Mr.Bill proposed to replace the current Canadian Pacific CEO Mr.Fred Green with the former CEO of CN Mr.Hunter Harrison. This proposal was promptly dismissed by the CP board which is filled with Canada’s old-world business elite. However Mr.Bill, an American, considers these individuals to be inept in running the railroad. Hence this could be a long drawn out power struggle between Mr.Bill and the CP board. For more juicy details readers may want to checkout an excellent article titled The story behind the all-out war to control CP published today by The Globe and Mail.

Some of the key metrics of the two railroads are listed below:

[TABLE=1053]

Source: Company websites

Canadian National has a much stronger presence in the U.S. than Canadian Pacific and CN dominates the industrial heartland of eastern Canada.

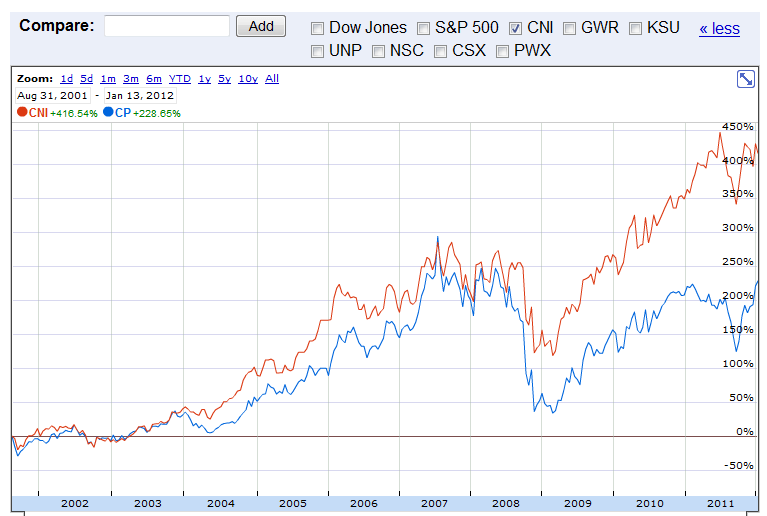
In terms of long-term equity performance, which is better – CN or CP?


Source: Google Finance

CN easily beat CP in the period shown above. CP’s stock performance in the past few years has been poor. This is one reason Mr.Bill Ackman believes it is time for a major shakeup of the company’s top management.

Microsoft’s Bill Gates is a major shareholder of Canadian National holding more than 46 million shares or 10.04% of the Montreal-based railroad as of April last year.

Related Infographic:

Click to enlarge


Source: CP’s rail reach,  The Globe and Mail

Disclosure: Long CN

Review: Callan Periodic Table of Investment Returns 2011

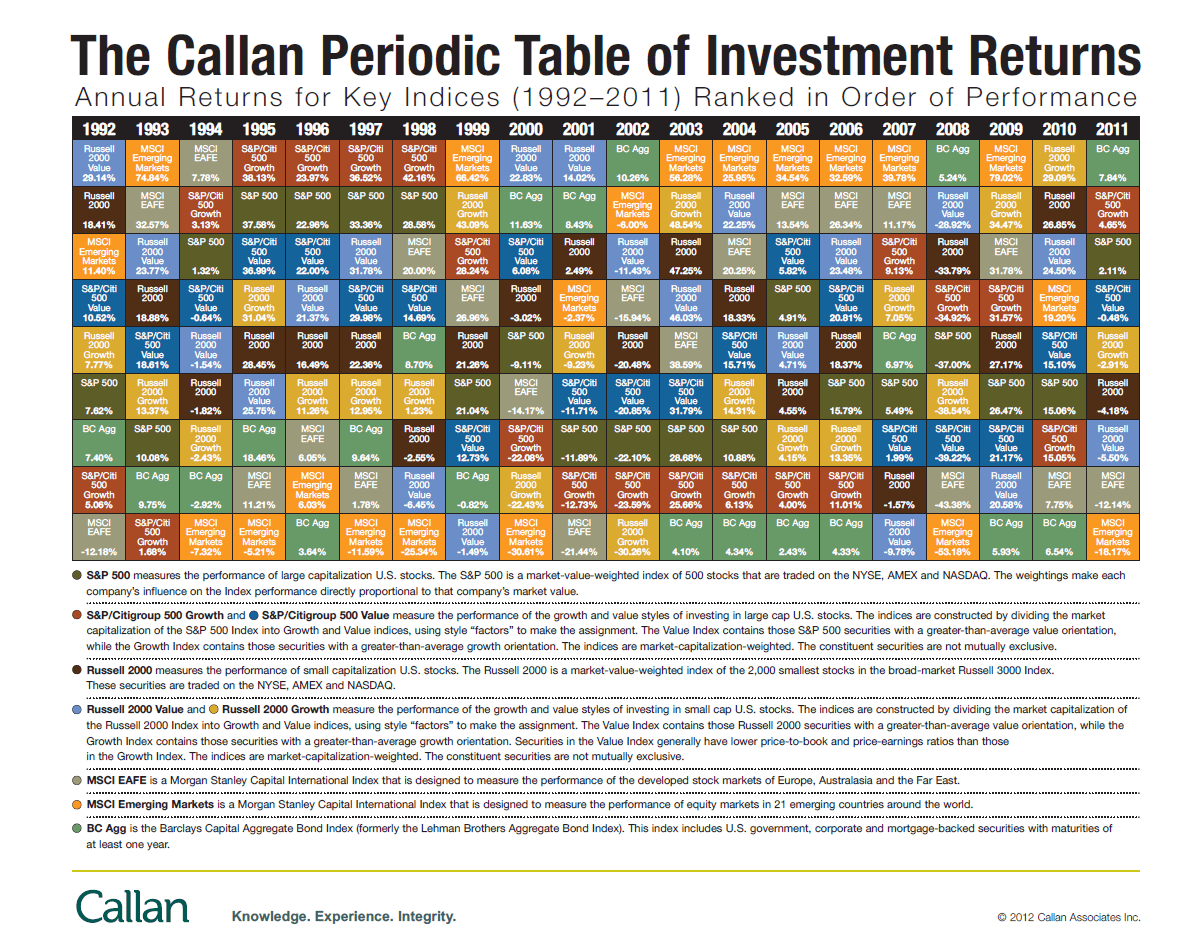
The Callan Periodic Table of Investment Returns for 2011 is shown below:

Click to enlarge


Source: Callan Associates

Some interesting observations noted by Callan include:

  • The U.S. markets generated a tiny 2.11% return which is better than the double digit losses for the overseas developed and emerging markets.
  • For only the third time in 13 years, small caps (-4.18%) trailed large caps (+2.11%) in 2011.
  • With a return of 7.84% fixed income was the best performing asset class last year.
  • In 2008 U.S. large cap stocks fell by 37%. The strong rallies of the S&P 500 in 2009 and 2010 were not enough to erase the losses of 2008. In addition, the lackluster performance in 2011 did not help the index get closer to the 2008 peak.

The Callan Charts for 2009 and 2010 can be found here and here.

Related ETFs:

iShares MSCI Emerging Markets ETF (EEM)
Vanguard Emerging Markets ETF (VWO)
SPDR S&P 500 ETF (SPY)
SPDR STOXX Europe 50 ETF (FEU)
SPDR DJ Euro STOXX 50 ETF (FEZ)
iShares iBoxx $ Investment Grade Corporate Bond Fund (LQD)
iShares Barclays US Aggregate Bond Fund(AGG)
Vanguard Total Bond Market ETF (BND)

Disclosure: No Positions

Related: The Callan Periodic Table of Investment Returns 2016: A Review

On the Dividend Yields of U.S. and Foreign Stocks

The New York Times published an interesting article this week discussing dividends paid by U.S. companies. The author Christine Hauser noted that the increased dividend payout last year is a sign of recovery.

From Dividends Rise in Sign of Recovery:

Companies listed in the Standard & Poor’s 500-stock index paid $240.6 billion in dividends in 2011, up from $205 billion in 2010. The 2011 payout was the largest since 2008, when firms had not yet been hit by the full brunt of the financial crisis and paid a record $247.8 billion in dividends.

Dividends are on track to set a record of more than $252 billion in 2012, according to data released by S.& P. that is based on the current dividend rates of 394 companies. While there could be some changes as the reporting season begins this week, analysts said companies were expected to continue to pay shareholders, possibly at the same rates or higher, as some of the economic and fiscal headwinds from 2011 tapered off.

“Dividends have been rising strongly,” said Binky Chadha, the chief strategist at Deutsche Bank. “And the rise that we have seen has plenty of upside.”

Companies that pay high dividends were some of the best performers in the markets last year.

Telecommunications, utilities and health care shares had the highest yield rates at the end of 2011, at 5.86, 4.13 and 3 percent, respectively.

I agree with the author’s conclusion since dividend payments come out of profits earned and is a strong indicator of a company’s financial performance.

Though it is commendable that U.S. companies are increasing their dividend payouts, they still lag when compared to the payouts of foreign companies. Relative to their overseas peers, U.S. firms hold over one Trillion $ in cash and equivalents on their balance sheets. So much higher payouts are possible.

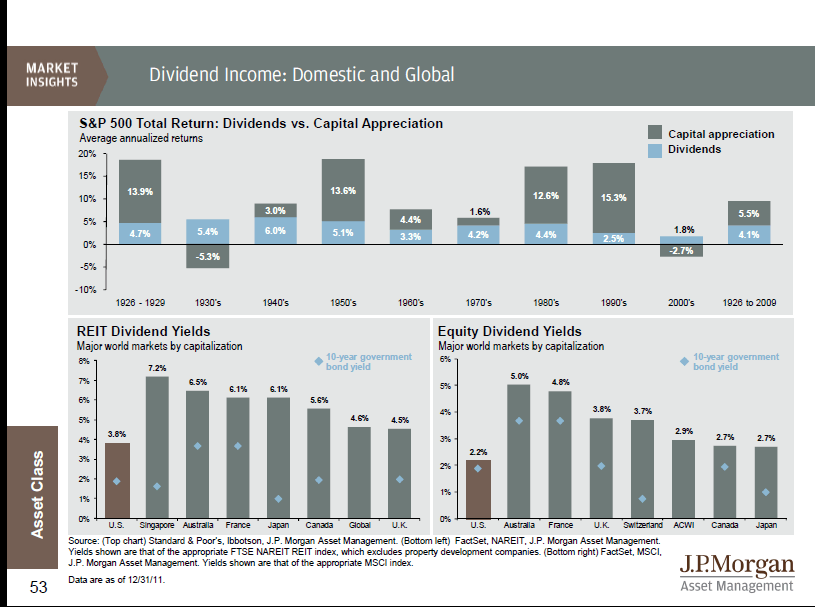
The current yield on the S&P 500 is 2.08%. At the end of 2011, the yield of the MSCI Index for U.S. stood at just 2.2% compared to much higher yields in other countries as shown in the graphic below:

Click to enlarge

Source: Guide to the Markets, 1Q 2012, J.P. Morgan Asset Management

While companies in certain industries in the U.S. have higher yields than the S&P 500, most of the others still hold a significant portion of profits as retained capital for future investment. Invariably these firms squander the funds on share buybacks, expensive acquisitions and other corporate actions due to short-term thinking by the management. In majority of the cases, these actions hurt long-term shareholders. Hence instead of narrowly focused on US firms, investors looking for dividend income should consider investing in foreign stocks. For example, most European companies have a tradition of paying high dividends in two installments per year. Though markets in Europe were crushed last year, excluding financials one can find other sectors which offer higher yields and growth.

Related ETFs:

SPDR S&P 500 ETF (SPY)
SPDR STOXX Europe 50 ETF (FEU)
iShares Dow Jones Select Dividend Index (DVY)
Vanguard European ETF (VGK)

Disclosure: No Positions

Impact of Inflation on Stock Returns

Investing in stocks produces the best return especially in the long-term. However when inflation is taken into account the return may not be the highest. Despite the best efforts of the U.S. Federal Reserve to combat inflation, it continues to grow year after. Inflation growth is particularly high in certain service industries such as health care, tax preparation, banking, asset management, real estate brokerage, etc.

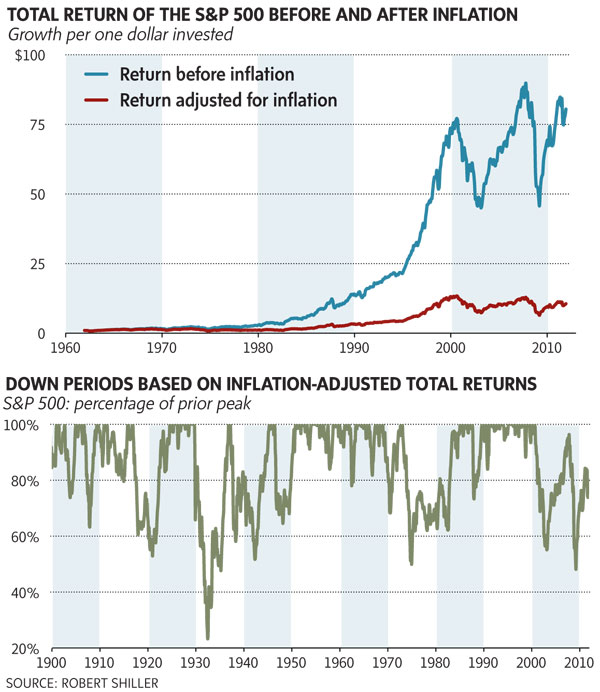
The following chart shows the total returns of S&P 500 since the early 1960s with and without adjustment for inflation:

Click to enlarge

Source: The scourge of inflation, The Globe and Mail

The total return on the S&P 500 since the early 1960s is an average of 9.6% per year. However when adjusted for inflation, the rate of return falls to just 4.8% per year. Since inflation affects taxes, asset management fees and others, the actual rate of return an investor earned during the period shown in the chart is only 1.3% when those factors are included in the rate of return calculation. Clearly 1.3% per year is not a great return for investing in  stocks.

The takeaway from this post is that investors should diversify their portfolio among various asset classes in order to earn an inflation-adjusted higher return. This would mean investing in stocks (in developed emerging markets), bonds (corporate, municipal and treasury), real estate, CDs, etc.

Related ETFs:
SPDR S&P 500 ETF (SPY)
SPDR DJ Euro STOXX 50 ETF (FEZ)

Disclosure: No Positions