U.S. Imports of Canadian Crude Oil and Petroleum Products Continue to Grow

Canada is the largest exporter of crude oil and other petroleum products to the U.S. Saudi Arabia ranks as second largest exporter to the U.S. followed by Mexico. Canada maintained the top position in both 2010 and 2011 and is likely to be a key supplier to the U.S. for many years to come.Due to continuing geo-political issues in the Middle East, the Canadian tar sands are bound to become more strategically important to meet the energy needs of the U.S.

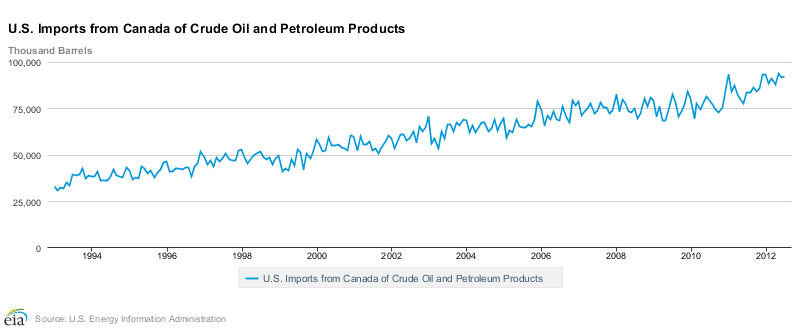
The following graph shows the long-term trend of Canadian Crude Oil and Petroleum Products exports to the U.S.:

Click to enlarge
Source: U.S. Energy Information Administration

In Jan 1991, U.S. imported 32,597(thousand barrels) from Canada. This figure jumped to 57,927(thousand barrels) in the beginning of 2000. By July of this year the U.S. imported 92,154(thousand barrels) for a rise of about three-fold from 1991.

A little-known but an important factor that favors Canadian crude oil over oil from other countries is that the Canadian oil blend is cheaper.

From an article in the CBC news site:
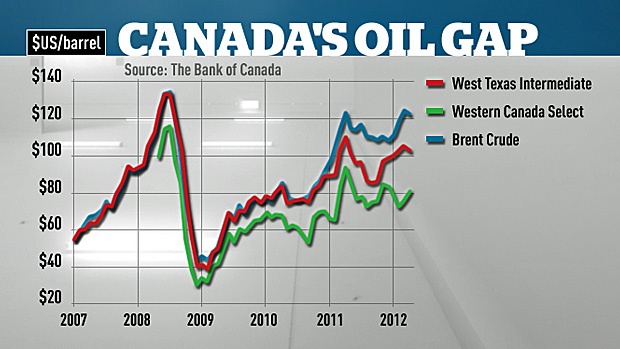
Many factors are pushing the price for North American crude lower, but the hit for Canadian oil companies specifically is even worse. The most prevalent Canadian benchmark is called Western Canadian Select. A blend of conventional oil, bitumen and synthetics, WCS is heavier and therefore more difficult to process than some other types of oil like Brent and WTI.

Because of the added transportation and refining costs, the profit margin a refiner can earn from using WCS is less than they would get from WTI. So refiners are paying Canadian producers less per barrel as a result.

Canada exports almost three million barrels of oil per day, and the spread has at times been in excess of $30 per barrel of late, so that’s $90 million in lost revenue, every day, for the oil patch.

It’s one of the things the Bank of Canada warned about in its latest Monetary Policy Report this week. Despite being awash in fossil fuels, Canadian producers aren’t getting as much money for their crude as suppliers elsewhere in the world do, which eats into GDP.

It’s especially vexing because Canadians pay the same high prices as the rest of the world for finished petroleum products like gasoline. Add it all up and the price Canada pays for the Brent-based oil it imports is going up, and the price Canada gets for the oil we export is going down — giving our economy a hit both coming and going.

How to profit from the growing Canadian crude oil and petroleum products exports to the U.S. market?

One way for investors to capitalize on this growth is to invest in Canadian oil companies that are involved in the exploration, extraction, storage and transportation of crude oil and related products to the U.S. Ten such stocks trading on the US markets are listed below for further research:

1.Company:Imperial Oil Ltd (IMO)
Market Cap: $39.1B
Current Dividend Yield: 1.05%

2.Company: Suncor Energy Inc (SU)
Market Cap: $51.7B
Current Dividend Yield: 1.56%

3.Company: Nexen Inc (NXY)
Market Cap: $13.5B
Current Dividend Yield: 0.80%

4.Company: Enbridge Inc (ENB)
Market Cap: $32.8B
Current Dividend Yield: 2.77%

5.Company: TransCanada Corp (TRP)
Market Cap: $32.6B
Current Dividend Yield: 3.86%

6.Company: Talisman Energy Inc (TLM)
Market Cap: $13.6B
Current Dividend Yield: 2.05%

7.Company: Canadian Natural Resources Ltd (CNQ)
Market Cap: $33.8B
Current Dividend Yield: 1.40%

8.Company: Encana Corp (ECA)
Market Cap: $16.0B
Current Dividend Yield: 3.67%

9.Company: Cenovus Energy Inc (CVE)
Market Cap: $26.5B
Current Dividend Yield: 2.56%

10.Company: Husky Energy Inc (HUSKF)
Market Cap: $27.3B
Current Dividend Yield: N/A

Note: Dividend yields noted are of Oct 6, 2012

Disclosure: No Positions
10 Largest Foreign Companies by Market Capitalization on the OTC Markets

Many foreign companies choose to list their stock on the OTC markets instead of the organized exchanges. Some of these companies  include foreign multinational corporations with large market capitalizations.

The ten largest foreign companies trading on the OTC markets based on market capitalization are listed below:

[TABLE=1138]

It is interesting to note that Walmart Mexico appears on this list with a market cap of over $50.0 billion. Walmart entered the Mexican market in 1991. Today the retail giant has 2,197 retail units in the country with 216 Supercenters and 130 Sam’s Club stores. In the U.S. it has 4,540 retail units with 3,000 Supercenters and  615 Sam’s Club stores.

Disclosure: No Positions

Role of Dividends in Real Equity Returns of Major Global Markets

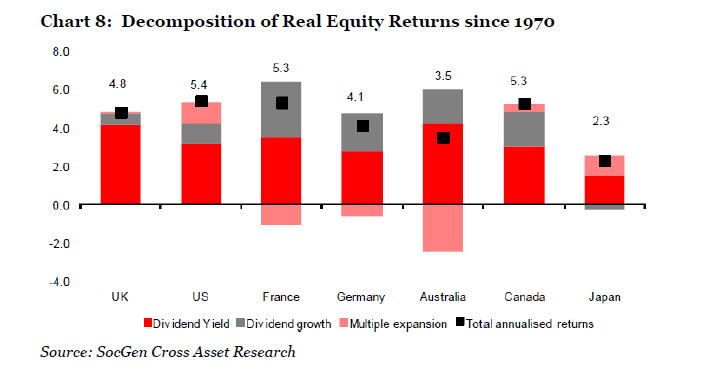
Dividends account a significant portion of the total return of stocks especially over long periods. But how much do dividend yields, dividend growth, multiple expansion contribute to total returns? The following chart from SocGen provides the answer:

Click to enlarge


Via The Absolute Return Letter, Oct  2012, Absolute Return Partners LLP

The U.S. has the highest annualized total returns at 4.4% among the countries noted.While dividend yields account for about 3% of total returns in the U.S. the dividend yield is much lower in Japan. In both Japan and U.S. multiple expansion plays  a strong role compared to other countries.Australia and the UK have had high dividend yields since 1970.Unlike Japan, the US and UK , dividend growth is high in France, Germany, Australia and Canada.

Ten dividend stocks to consider from the countries listed above (excluding Japan) are listed below:

1.Company: Royal Bank of Canada (RY)
Sector: Banking
Current Dividend Yield: 4.18%
Country: Canada

2.Company:British American Tobacco PLC (BTI)
Sector: Consumer products
Current Dividend Yield: 3.97%
Country: UK

3.Company: Telstra Corp Ltd(TLSYY)
Sector: Telecom
Current Dividend Yield: 7.23%
Country: Australia

4.Company: RWE AG (RWEOY)
Sector: Electric Utilities
Current Dividend Yield: 5.67%
Country: Germany

5.Company: National Grid PLC (NGG)
Sector: Electric Utilities
Current Dividend Yield: 5.53%
Country: UK

6.Company: Exelon Corp (EXC)
Sector: Electric Utilities
Current Dividend Yield: 5.85%
Country: USA

7.Company: National Australia Bank Ltd (NABZY)
Sector: Banking
Current Dividend Yield: 6.77%
Country: Australia

8.Company: Enbridge Inc (ENB)
Sector:Natural Gas Utilities
Current Dividend Yield: 2.77%
Country: Canada

9.Company: Axa SA (AXAHY)
Sector: Life Insurance
Current Dividend Yield: 5.77%
Country: France

10.Company: Cullen/Frost Bankers Inc (CFR)
Sector: Banking
Current Dividend Yield: 3.31%
Country: USA

Note: Dividends noted are as of Oct 5, 2012

Disclosure: Long AXAHY,RY, RWEOY

Australia’s Major Trading Partners in 2012

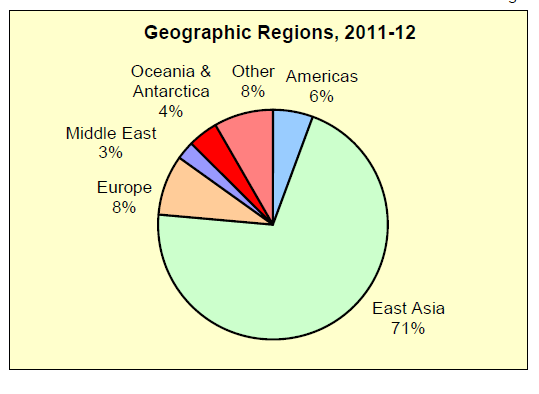
In this post lets take a quick look at Australia’s major trading partners this year. The graph below shows Australia’s export regions:

Click to enlarge


The majority (71%) of Australia’s exports goes to East Asia with China, Japan and Korea being the major export markets. Australia’s trade with Asian countries is significantly large compared to its trade with Europe and Americas. China is the largest export market for Australia since the Chinese demand for Australia’s natural resources such as coal is high.

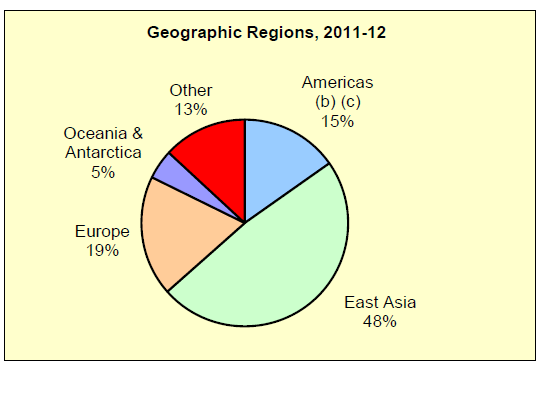
The chart below shows Australia’s import sources:

East Asia is the major source of imports for Australia with China and Japan accounting for the majority of imported goods.  The U.S. is the third largest import source for Australia.

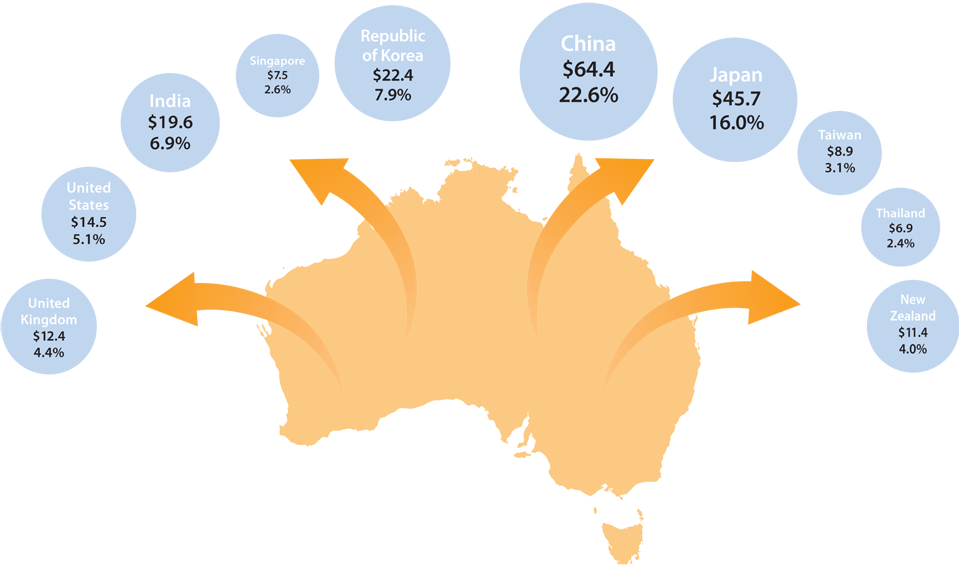
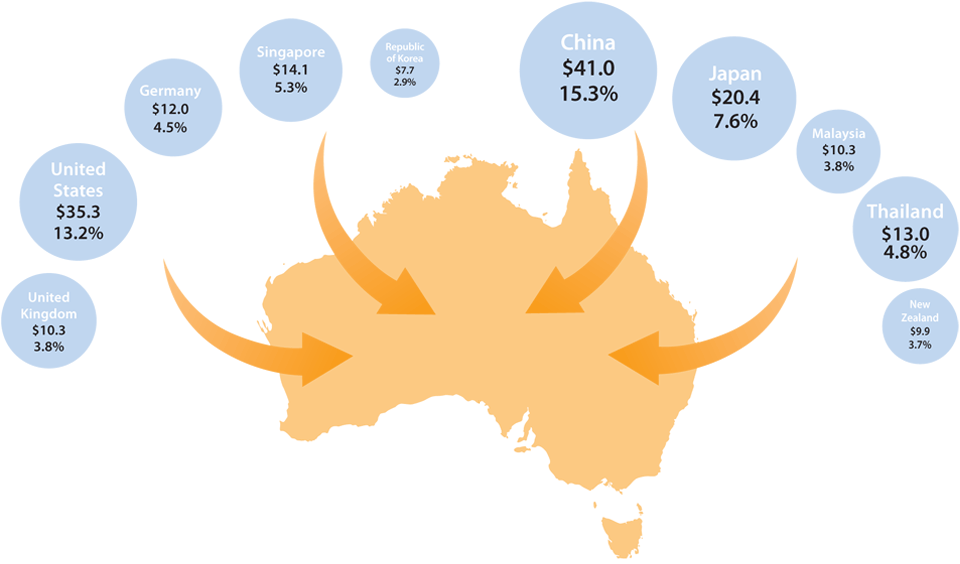
Australia’s major trade partners in 2010 are shown in the graphs below.

Australia’s Top 10 Export Markets 2010 ($ billion):

Click to enlarge

Australia’s Top 10 Import Markets 2010 ($ billion):

Source: Summary of Australia’s Trade, Department of Foreign Affairs and Trade

Related ETF:

iShares MSCI Australia Index (EWA)

Disclosure: No Positions

A History of Bubbles

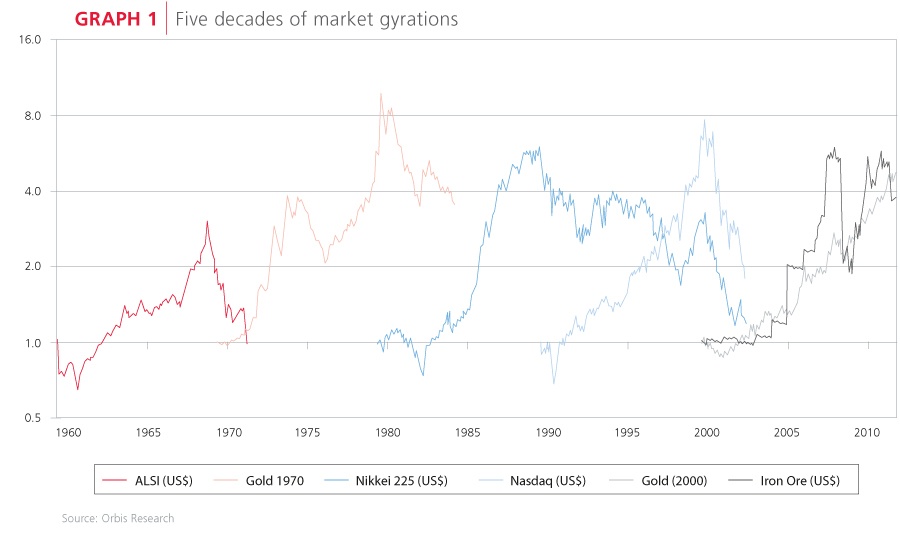
I came across an interesting article by Jonathan Brodie of South Africa-based Allan Gray Proprietary Limited discussing stock market bubbles and how extreme bearish mainstream media cover stories about investing in stocks are contrary indicators. The famous 1979 BusinessWeek cover that pronounced the ‘Death of Equities‘ was a classic example of such contrary indicators.

Click to enlarge

Some key takeaways from the article:

  • In the second half of 1980s, the Nikkei 225 nearly quadrupled in value and stood at an all-time high of about 39,000 by the end  of 1989. By then books on Japanese management techniques became the craze of the world and then Nikkei lost half its value by 1992 and  then halved again by 2003.
  • Two decades after the BusinessWeek article, the internet and technology-related stocks propelled Nasdaq to an all-time high only to plunge  70% by 2003 when the dot-com bubble burst. Books such as Dow 36 000 and Jeremy Siegel’s Stocks for the Long Run became the must-reads during the tech mania. The high-tech darling of the time, Cisco Systems (CSCO) became the most valuable company in the world for a brief period. Later the company’s shares collapsed by over 85% when the party ended.
  • The rise and fall of South Africa’s FTSE/JSE All Share Index (ALSI) in the 1960s as shown in the chart above is another example of bubble that inevitably bursts.  By 1969, the index had risen by about 500% in the decade “prompting the Financial Mail to quote a leading broker who declared that ‘the market is now in orbit, and the force of gravity no longer applies.” The market did not stay in the orbit for too long and after two years the index had lost two-thirds of its value.

The chart above also shows the dramatic rise and fall of gold in the 1970s and iron ore in the last decade.

Source: Investing: a history of bubbles, Jonathan Brodie, Allan Gray Proprietary Limited, South Africa

Related ETFs:

SPDR Gold Trust (GLD)
iShares MSCI South Africa Index (EZA)
PowerShares QQQ Trust (QQQQ)
iShares MSCI Japan Index (EWJ)
Market Vectors Steel (SLX)

Disclosure: No Positions