A Comparison of Canadian and U.S. Housing Markets

Is the Canadian housing market in a bubble or not? Its a question that Canadians and foreign investors in Canada worry about these days. Almost not a week goes by without the media talking about the housing market in Canada. This is because housing prices in Canada continue to remain strong despite weakness in the economy. Rightly so many investors wonder how long the party can last.

Though the Canadian economy is highly dependent on the U.S., the country’s housing market has remained exceptionally strong in the past few years. Instead of trying to predict if the housing market in Canada will crash or not, investors may be better off trying to understand why the market is holding up so well. Though the U.S. and Canada are closely integrated in many ways, the housing markets are vastly different between the countries. In this post, let us take a look at some of the differences between the U.S. and Canadian housing markets.

The chart below shows the growth of house prices in US and Canada since 2000:

Click to enlarge
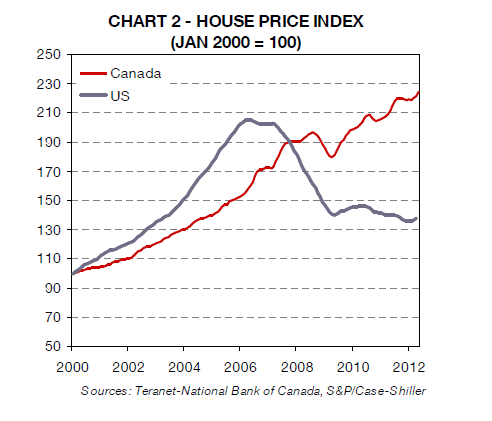
Home prices in Canada have followed an upward trend since 2000. While housing prices fell during the recession starting in September 2008 prices have again recovered strongly to exceed pre-recession levels by about 14.1%. Compared to the Canadian market, the prices in the U.S. have fallen heavily since the recession and only this year has started to moderate or rebound slightly.

Some of the difference between Canadian and U.S. housing markets are listed below:

[TABLE=1127]

Source: Housing Market and Macroprudential Policies: Is Canada a Success Story?, Econote, August 2012, Societe Generale
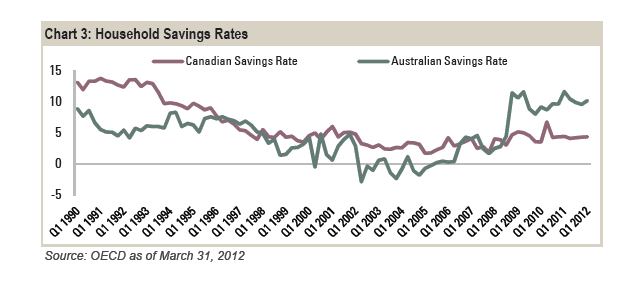
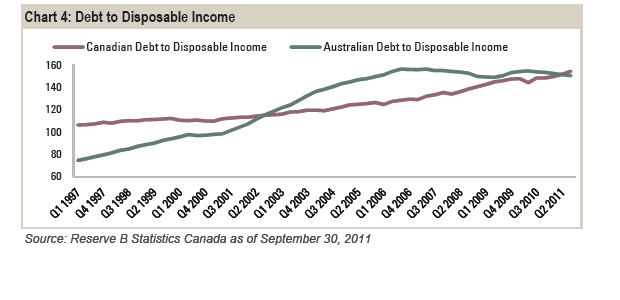
Australia Vs. Canada: Household Savings Rate and Debt to Disposable Income

The Canadian household savings rate in 1990 was higher than Australia’s household savings rate. However as a result of the global financial crisis and high interest rates the Australian savings rate jumped from negative 2% to 12% before stabilizing at around 10%. The Canadian savings rate has continued to follow the downward trend since 1990 though it has also stabilized as shown in the graph below:

Click to enlarge


The following chart shows the comparison of debt to disposable income between the two countries:


Unlike Canada, the Australian debt to disposable income is declining since the financial crisis. Rising wage growth combined with higher savings rate puts Australian households in better shape than Canadian households.

Source: How Safe Are The New Safe Havens, by Nathaniel Hyde, CFA, Global Bond Strategies, Standish Mellon Asset Management Company LLC

Equity Market Performance Comparison: Brazil vs. Mexico

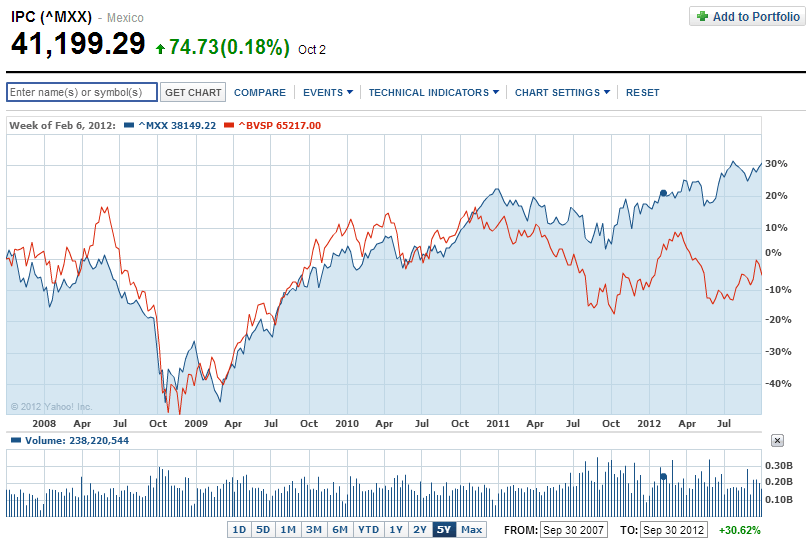
Brazil has been the hot emerging market destination until recently. The country’s economy and stocks performed extremely well due to the commodity market boom before the global financial crisis. However global investors’ attraction towards Brazil has waned recently despite many positive factors favorable to the economy including the hosting of Olympic Games in 2016 and the World Cup in 2014. In terms of equity market returns, compared to the S&P 500’s rise of 15.0% year-to-date (YTD), the Brazilian benchmark Bovespa index has gained only 4.3%.

The Mexican economy stabilized and expanded under the leadership of outgoing President Felipe Calderon despite the bloody violence due to drug cartels. Mexico’s IPC index is up about 11.0% YTD and the index may go up higher as a result of the economic reforms promised by the incoming President Enrique Pena Nieto.

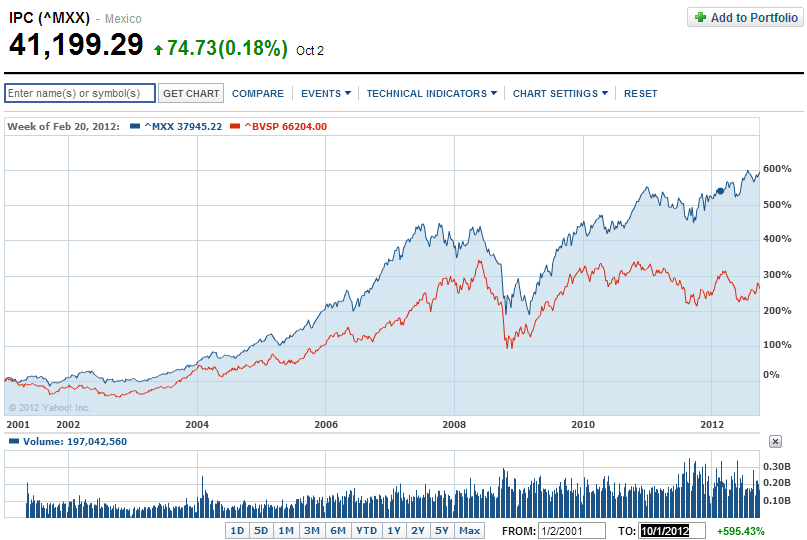
Over long term also Mexican stocks have yielded higher returns than Brazilian stocks. This may come as a surprise to many investors since the Mexican economy is highly dependent on the U.S. economy which is experiencing lackluster growth in recent years. The superior performance of Mexico relative to Brazil is more interesting considering the limited natural resources available in Mexico relative to Brazil and the ongoing drug violence.

Performance comparison of IPC Index and Bovespa over 5 years:

Click to enlarge

In the past 5 years, the IPC has returned 30.62% while  Bovespa has lost about 5%.


Performance comparison of IPC Index and Bovespa from 2001 to YTD:


Since 2001, Mexico’s IPC Index has shot up nearly six-fold. During the same period Bovespa went up only 260%. The U.S. market lagged both Mexico and Brazil by a significant margin. The S&P 500 rose just 11% in the same time.

Related ETFs:
iShares MSCI Brazil Index (EWZ)
iShares MSCI Mexico Investable Market Index (EWW)
SPDR S&P 500 ETF (SPY)

Disclosure: No Positions

The Top 15 British Dividend Paying Stocks

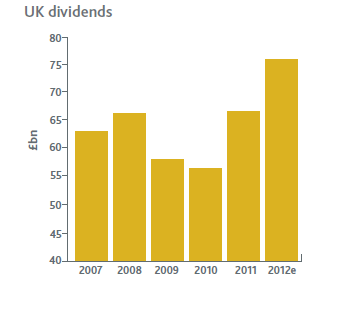
Many British companies are increasing dividend payments this year. According to a report by Capita Registrars, large British firms are projected to payout a record £78.3 billion in dividends. In the first half £41.4 billion was paid out in dividends including special dividends by GlaxoSmithkline and Old Mutual. Oil majors were some of the biggest dividend raisers.

The Top 15 Companies based on dividends paid in the first of 2012 are listed below with the ADR ticker if available:

[TABLE=1136]

Source: Capita Registrars UK Dividend Monitor, Issue 12, Capita Registrars Limited

Disclosure: No Positions

South Africa’s Standard Bank Group Starts Sponsored ADR Program

South Africa-based Standard Bank Group has established a sponsored American Depositary Receipt (ADR) program effective September 28, 2012 with the ticker SGBLY. Earlier the company traded as an unsponsored DR on the OTC market.

From the BNY Mellon press release:

Founded in 1862 and headquartered in Johannesburg, Standard Bank Group is the largest African bank by assets and earnings.  Standard Bank offers a range of banking and related financial services in 18 countries on the African continent as well as in other select emerging markets. The company has 1,222 branches, including loan centers, and 7,945 ATMs across Africa.  Standard Bank employs more than 52,000 people across all geographies and has a market capitalization of about $20 billion.

“We are delighted to partner with BNY Mellon in establishing a sponsored ADR program and to be traded on the U.S. OTC market,” said Simon Ridley, CFO of Standard Bank Group.  “There is great scope for the expansion of banking services in sub-Saharan Africa, and this ADR program is an exciting new source of potential investors to drive our growth strategy.”

Currently, 36 of the Johannesburg Stock Exchange ‘Top 40’ constituents, by market cap, have a DR program.  BNY Mellon is depositary for 30 of those.  Standard Bank Group is the fifth new South African sponsored DR program established by BNY Mellon since June.

The bank’s latest Tier 1 capital adequacy ratio stands at 11%. Foreign shareholders hold 46.2% of the total outstanding shares with  China’s Industrial and Commercial Bank of China holding a large stake of 20.1%. The bank’s total assets stood at about US $ 189.0 billion as of June 30, 2012.

Standard Bank Group Ltd (SGBLY) closed at  $12.80 and has a dividend yield of 9.85%.

For more information please visit their investor relations site.

Disclosure: No Positions