Ten Emerging Asia Dividend Stocks To Consider

Emerging market stocks have traditionally been favored by investors for their price appreciation potential. Most emerging markets were not known for high dividend yields and investors did not focus their attention on emerging market stocks for their dividend yields. However that need not be the case now as many emerging market companies pay high and consistent dividends similar to those in developed markets.

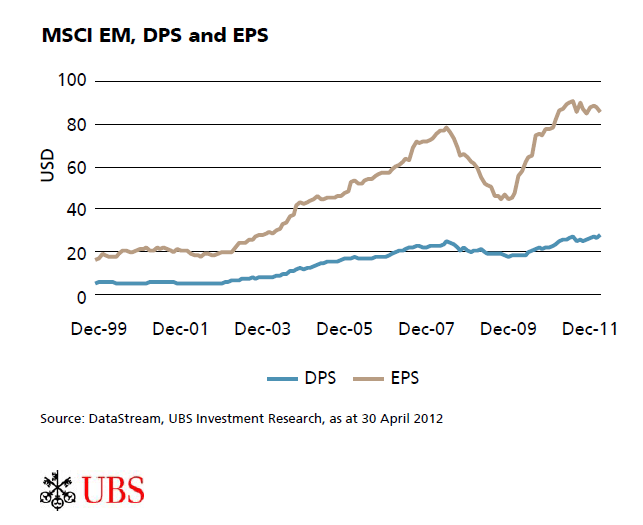
The following chart shows the Dividend Per Share(DPS) and Earnings Per Share(EPS) for the MSCI Emerging Market Index:

Click to enlarge
Some of the reasons to invest in emerging market dividend stocks include:

  • Companies in the MSCI Emerging Markets Index have increased dividend payments steadily for the last ten years.
  • Unlike earnings, dividend payments have been more steady.
  • Dividend payout ratios have been stable and stood mostly in the 30% to 40% range.
  • As many of these companies mature the potential to increase dividend payouts is high.
  • Emerging market companies have lower debt levels than developed market companies.
  • Emerging companies also have high cash levels on their balance sheets.
  • The number of emerging stocks in the MSCI World Index having high dividends yields has increased from 60 in 1995 to 302 in 2011.

Source: Harvesting dividends from growing regions, UBS

Ten Asian Emerging Stocks are listed below with their current dividend yields:

1.Company: Taiwan Semiconductor Manufacturing Co Ltd(TSM)
Current Dividend Yield: 3.15%
Sector: Semiconductors
Country: Taiwan

2.Company:PetroChina Co Ltd (PTR)
Current Dividend Yield: 3.68%
Sector: Oil & Gas Operations
Country: China

3.Company:Philippine Long Distance Telephone Co (PHI)
Current Dividend Yield: 4.14%
Sector:Communications Services
Country:Philippines

4.Company: Malayan Banking Bhd (MLYBY)
Current Dividend Yield:7.09%
Sector: Banking
Country: Malaysia

5.Company: Posco (PKX)
Current Dividend Yield: 3.45%
Sector: Iron & Steel
Country: Korea

6.Company:China Petroleum & Chemical Corp (SNP)
Current Dividend Yield: 4.40%
Sector: Oil & Gas Operations
Country: China

7.Company:Chunghwa Telecom Co Ltd (CHT)
Current Dividend Yield: 5.81%
Sector: Telecom
Country: Taiwan

8.Company: S-Oil Corp (SOOCY)
Current Dividend Yield:
Sector: Oil & Gas Operations
Country: South Korea

9.Company: PT Telekomunikasi Indonesia (TLK)
Current Dividend Yield: 3.37%
Sector: Telecom
Country: Indonesia

10.Company: SK Telecom Co Ltd (SKM)
Current Dividend Yield: 5.81%
Sector: Telecom
Country: South Korea

Note: Dividend yields noted are as of December 2, 2012

Disclosure: No Positions

Related:

JP Morgan makes case for emerging markets income (Trustnet, UK)
Knowledge is Power: Turkey, Sandy, Taxes Edition

Turkey: can stocks go any higher? (Beyond BRICs)

The best way to invest in Britain’s stockmarket (MoneyWeek)

Load up on Canadian equities, says Canaccord strategist (Financial Post)

How to take a punt on the eurozone (TrustNet UK)

Are Taxes Headed Higher? (Charles Schwab)

Hurricane Sandy –  Costs to come (The Economist Blog)

Economically speaking, Hurricane Sandy not seen as devastating (Macleans)

Internet traffic exchange: 2 billion users and it’s done on a handshake (OECD Insights Blog)

Picking dividend stocks (Fidelity ViewPoints)

A Visit to Google Land – The Intransparent Methods of an Internet Giant (Der Spiegel)


Source: Global Finance

Average Stock Holding Periods on Select Global Exchanges

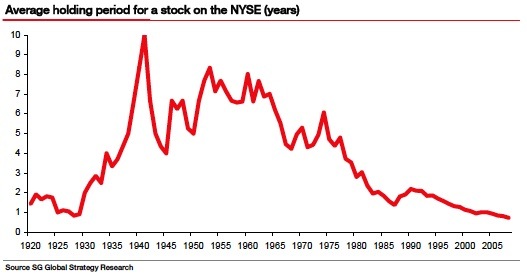
In September, 2010 I wrote an article discussing the decline average holding periods on the major stocks exchanges of the world. One of the charts included in that post is the following chart for the NYSE:

Click to enlarge


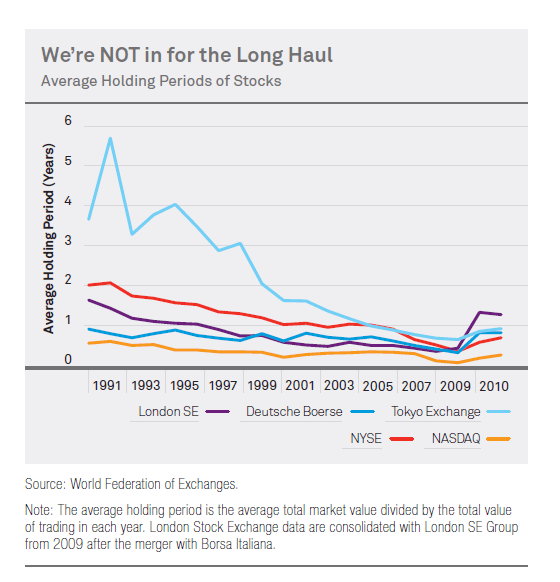
The average holding period for stocks has declined on most major exchange for many years now for due to short-term mentality of individuals and institutions alike, lower transaction costs, growth of hedge funds, high-frequency trading, growth of ETFs, etc.According to one report, investors held stocks on the New York Stock Exchange(NYSE) for  an average of two years in 1991 but only for five months in 2008. However this situation has improved since the financial crisis of 2008 and in 2010 the average holding period was eight months as shown in the chart below:


Source: Means, Ends and Dividends, March 2012, BlackRock Investment Institute

Inequality of Income Between Select Countries

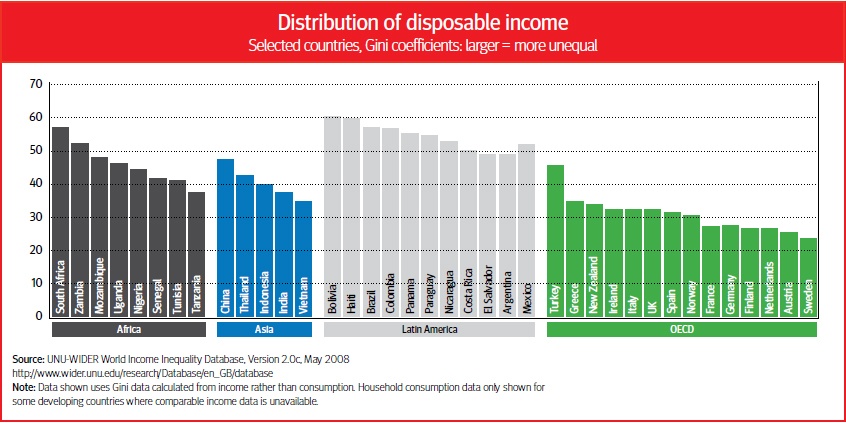
The Gini Coefficient measures inequality of income or wealth between countries. The higher the ratio the higher the inequality.Countries such as Brazil, Russia, China, India, USA, etc. have high Gini coefficients due to the extreme disparity in wealth and income between the elite and the rest of the population.

The following chart shows the Gini coefficients for select group of countries based on disposable income:

Click to enlarge

Source:  How tax can reduce inequality, OECD Observer

In Asia, China is more unequal than India. Among the OECD countries, Turkey is more unequal than Sweden which is not surprising.

From the OECD article:

A rising tide may not now lift all boats, to misquote US President Kennedy’s original analogy made in 1963 linking economic growth to prosperity for all. Can governments maintain the social cohesion needed for sustainable, long-term growth? Supporting an equitable income distribution remains one of the key goals of fiscal (and tax) policy.

The rapid growth of emerging economies in the past decade or so has lifted hundreds of millions of people out of absolute poverty and reduced income disparities across the world as a whole. At the same time, until the financial and economic crisis of 2008, most other economies were expanding too. However, within the OECD and emerging economies not all regions or people benefitted equally from the growth years. On the contrary, the distribution of income tended to become more unequal.

The Top 25 Global Pharmaceutical Companies by 2011 Sales

The Pharmaceutical Executive magazine published earlier this year its annual ranking of the Top 50 Pharmaceutical Companies by revenue. The following table lists the top 25 global companies ranked based on sales in 2011:

S.No.CompanyTicker2011 Rx Sales (in $ Billions)Country
1PfizerPFE$57.70USA
2NovartisNVS$54.00Switzerland
3MerckMRK$41.30USA
4SanofiSNY$37.00France
5RocheRHHBY$34.90Switzerland
6GlaxoSmithKlineGSK$34.40UK
7AstraZenecaAZN$33.60UK
8Johnson & JohnsonJNJ$24.40USA
9AbbottABT$22.40USA
10Eli LillyLLY$21.90USA
11Bristol-Myers SquibbBMY$21.20USA
12TevaTEVA$16.70Israel
13AmgenAMGN$15.30USA
14TakedaTKPYY$15.20Japan
15Boehringer IngelheimN/A$13.80Germany
16BayerBAYRY$12.80Germany
17Daiichi SankyoDSNKY$11.60Japan
18Novo NordiskNVO$11.50Denmark
19AstellasALPMY$11.40Japan
20Gilead SciencesGILD$8.10USA
21OtsukaOTSKY$7.40Japan
22Merck KGaAMKGAY$7.20Germany
23Baxter InternationalBAX$6.10USA
24MylanMYL$5.50USA
25ServierN/A$5.00France

Source: Pharmaceutical Executive

The top 50 companies accounted sold $610 billion in human prescription pharmaceuticals last year and just the top 10 accounted for 59% of the total sales of the 50 companies. Four companies that dropped off the ranking due to mergers are Genzyme, Alcon, Cephalon and Nycomed. Israel-based world’s largest generic drug maker Teva(TEVA) was ranked at number 12. Amgen(AMGN) and Gilead Sciences(GILD), two of the hot biotech companies from the 90s, appear in the above list as well.

The complete list of the top 50 companies and other rankings can be found in the pdf document located here.

Related:

The World’s 50 Largest Pharmaceutical Companies by Sales (in 2010)

The Top 50 Global Pharma Companies 2013

Disclosure: No Positions