When Will The Dow Reach 20,000?

The Dow Jones Industrial Average closed at a record 14,329.49 yesterday. The S&P 500 closed at 1,544.26. With the Dow breaking past the previous record high some investors are wondering if this bull run is sustainable and how high the markets will go. The media is filled with stories of all types of forecasters and pundits predicting the continued upward trajectory of the stock market.

Here is James K. Glassman , executive director of the George W. Bush Institute with this Dow 36,000 article in Bloomberg:

The Dow Jones Industrial Average set a record this week, but it’s still far from the mark that economist Kevin Hassett and I forecast in our 1999 book, “Dow 36,000.”

We wrote in the introduction that “it is impossible to predict how long it will take” to get to 36,000. Then, in the same paragraph, we rashly made a guess anyway: “between three and five years.”

Today, the far edge of that time frame is clearly in reach. From its low of 6,547 on March 9, 2009, the Dow has risen 117 percent. Another 117 percent in four years would put it at 31,022, just 16 percentage points shy of the magic number.

Mr.Glassman prediction in 1999 did not come true but now states that the Dow may reach over 31,000 in just four years based on some wild assumptions. However a much closer figure from current levels is Dow 20,000.

When will the Dow reach the next psychologically-important milestone of 20,000? 

Certainly I do not know the answer. There are too many variables to consider especially when some are voicing concerns over the  irrational exuberance of investors and questioning if the current stock prices are warranted given the weak macroeconomic conditions.

Last August,  Seth J. Masters, Chief Investment Officer for Asset Allocation at AllianceBernstein and Chief Investment Officer of Bernstein Global Wealth Management wrote a fascinating article providing a possible answer to my question above. From the article:

The models we use when investing are complex, but a simple argument makes the point. The expected return for a Treasury bond held to maturity is equal to its yield. Similarly, the expected return for a stock equals its earnings per share (EPS) divided by its price—its earnings yield—if the company has no growth prospects and therefore returns all of its earnings to shareholders. If the company does have growth prospects, it would retain some of its earnings to fund growth. In that case, the expected return equals the dividend yield plus dividend growth. If the company pays out a constant share of earnings as dividends, dividend growth equals earnings growth.

Let’s apply this framework to the S&P 500 Index’s price level of about 1,300. Consensus forecasts call for the index to have $104 in earnings per share this year. If the companies in the index didn’t expect any growth, they would pay out all their earnings as dividends, and earnings and dividends wouldn’t grow. The S&P 500’s dividend yield would be 8%, as the first row of the display below shows.

Click to enlarge

Dow-20000

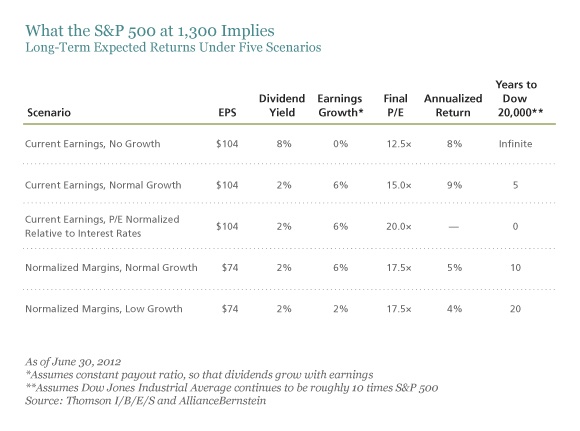
Source: The Fundamental Case for the 20,000 Dow, August 13, 2012, The AllianceBernstein Blog on Investing

The chart shows the number of years for the Dow to reach 20,000 based on five different scenarios.  It would be interesting to see how the Dow performs in the next few years.

The chart below shows the 10-year return of Dow and S&P 500:

Dow-vs-SP500-10-Year-Return

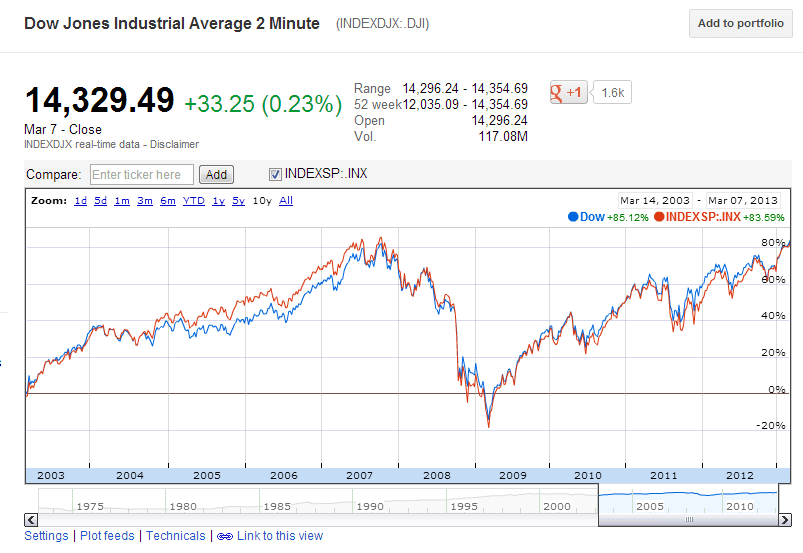
Source: Google Finance

Clearly both the Dow and the S&P have had an astonishing recovery from the lows of the global financial crisis.

Related ETFs:

  • SPDR S&P 500 ETF (SPY)
  • SPDR Dow Jones Industrial Average ETF (DIA)

Disclosure: No Positions

A Look At Three Truck Maker Stocks

Truck markers may see an upswing in sales as the economic recovery continues to strengthen. Three of the truck makers are listed below with their current dividend yields and market caps:

1.Company: Navistar International Corp (NAV)
Current Dividend Yield: No dividend Paid
Market Cap: $2.6 B

2.Company: Oshkosh Corp (OSK)
Current Dividend Yield: No dividend Paid
Market Cap:$3.5 B

3.Company: PACCAR Inc (PCAR)
Current Dividend Yield: 1.65%
Market Cap:$17.5 B

Note: Dividend yields noted are as of Mar 7, 2013

Disclosure: No Positions

TruckOf these companies, PACCAR is the largest in terms of market cap and it pays a dividend too with a yield of about 1.65%.  Both Oshkosh and Navistar are mid-cap stocks and pay no dividends.

Oshkosh is a major military equipment maker specializing in trucks and other vehicles. Hence the company’s sales are dependent more on Pentagon orders than the other two competitors. Oshkosh had sales of over $8.0 billion last year and the profit margin was just about 3%.

PACCAR sells its vehicles and parts in North America, Europe and Australia. In the U.S. its trucks are sold under the Kenworth and Peterbilt brands.Total revenues exceed $17.0 billion in 2012 and the profit margin was about 6.5%.

Similar to Oshkosh, Navistar also makes both commercial and military vehicles. Total revenue in 2012 was about #13.0 billion but the company had a loss.

The following chart shows the multi-year return of these companies:

Click to enlarge

Three-Maker-Stock-Returns-Since-2000

Source: Yahoo Finance

PACCAR is the best performer since 2000. Navistar has been the worst performer. That sharp spike in Osh Kosh’s share price is due to a bid from activist investor Carl Icahn to buy the company. Mr.Ichan’s later abandoned his efforts to control Osh Kosh as the company rejected his bid as a “low-ball” price.

Hat Tip:  Navistar Ready to Put Pedal to the Metal (WSJ)

The Top 20 Australian Companies by Market Capitalization

The ASX Top 20 is comprised of the largest 20 Australian publicly-listed companies by market capitalization. The following table lists these companies with their tickers on the US markets ,if available and the current dividend yields:

S.No.CompanyTickerMarket Capitalization as of Mar 6, 2013 (in A$s)Dividend Yield as of Mar 5, 2013Sector
1RIO TINTO LIMITEDRTNTF$358,707,607 3.57%Materials
2BHP BILLITON LIMITEDBP$287,153,366 3.07%Materials
3COMMONWEALTH BANK OF AUSTRALIA.CMWAY$277,839,804 7.26%Banking
4WESTPAC BANKING CORPORATIONWBK$242,871,846 5.30%Banking
5NATIONAL AUSTRALIA BANK LIMITEDNABZY$237,245,326 6.05%Banking
6AUSTRALIA AND NEW ZEALAND BANKING GROUP LIMITEDANZBY$179,818,344 5.16%Banking
7WESTFIELD RETAIL TRUSTWTSRF$161,986,724 6.07%Real Estate
8TELSTRA CORPORATION LIMITED.TLSYY$137,753,923 6.30%Telecom
9WOODSIDE PETROLEUM LIMITEDWOPEY$132,143,008 4.85%Energy
10WESFARMERS LIMITEDWFAFY$120,476,736 4.25%Food and Consumer Staples retail
11FORTESCUE METALS GROUP LTDFSUGY$114,421,357 1.85%Materials
12WOOLWORTHS LIMITEDWOLZY$103,445,038 0.00%Food and Consumer Staples retail
13NEWCREST MINING LIMITEDNCMGY$97,304,201 1.57%Materials
14CSL LIMITEDCMXHY$89,275,653 1.60%Pharma and Biotech
15NEWS CORPORATIONNWS$84,386,026 0.56%Media
16QBE INSURANCE GROUP LIMITEDQBIEY$67,525,699 3.63%Insurance
17ORIGIN ENERGY LIMITEDOGFGY$66,500,998 4.05%Energy
18BRAMBLES LIMITEDBMBLY$63,791,119 3.07%Professional Services
19WESTFIELD GROUPWFGPY$59,961,187 4.50%Real Estate
20OIL SEARCH LIMITEDOISHY$57,041,477 0.51%Energy


Data Sources: Australian Financial Review and Business Spectator

Since Australia is a resources-based economy, the top two highly valued companies are in the materials sector. Four banks are the next most valued companies. This is not surprising since banks act as the financial pillar of the Australian economy providing financing to companies and consumers alike. Since the real estate sector has held up well in the past few years Aussie banks have not been adversely impacted like their peers in Europe and in the U.S. Australian banks also have high exposure to the fast growing markets in Asia. For example, ANZ Banking Group (ANZBY) was recently named as one of the top four corporate banks in Asia.

From an investment standpoint, the four banks noted and the Telstra(TLSYY) look attractive at current or lower levels for long-term investment. Investors willing to add commodity stocks which can be highly volatile can consider the resource companies shown in the table above.

Note: Dividend yields noted are as of Mar 5, 2013

Disclosure: No Positions

Italian Stocks Hit With Financial Transaction Tax (FTT)

Italy-flagLast year France became the first country to enact the Financial Transaction Tax (FTT) on stocks and other financial instruments. Other European countries were expected to follow this trend.

Effective March 1st, 2013, the Italian government has imposed a Financial Transaction Tax (FTT) on stocks and other instruments. Though it has not been confirmed by ADR issuers, this tax will most likely be applied to Italian ADRs as well.  A few points to remember regarding the Italian Financial Transaction Tax:

  • Effective March 1st Italian companies headquartered in Italy with a market capitalization of EUR 500.0 million or more will be subject to the FTT. Buyers of stocks in these companies will be levied a tax of 0.12% of the total purchase amount.
  • In addition to the FTT, a High-Frequency Trading Tax (HFTT) of 0.02% will be levied on HFT orders.
  • U.S. stocks brokers will be required to collect the new taxes and remit to the Italian government by the 16th of the month following the transactions.

For more related information please see:

Financial Transaction Tax in Italy (ABN Amro)

Italian financial transactions tax – Italy imposes Tobin tax on financial transactions (Norton Rose)

ITALY – Financial Transaction Tax – update 2 (RBC Investor Services)

Global FS tax newsflash: Financial transaction taxes — the Italian FTT takes shape (PWC)

Italy Introduces a Financial Transaction Tax as of 2013 (Harvard Law School Blog)

Financial-transaction taxes – Skimming the froth (The Economist, December 2012)

Airgas: A Superb Stock To Own in the Chemicals Sector

ChemicalsOne of the best sectors to own during any market is the chemical sector. Though they are cyclical chemical stocks tend to perform well in the long-run. In the mid-cap chemicals space, one of the names investors can consider is Airgas Inc (ARG). The company is an industrial gas distributor with a solid track record.

The excellent  performance of Airgas since 2000 is shown below:

Click to enlarge

Airgas-Returns-Since-2000

Source: Yahoo Finance

A brief overview from the corporate site:

Airgas, Inc. (NYSE: ARG), through its subsidiaries, is one of the nation’s leading suppliers of industrial, medical and specialty gases, and hardgoods, such as welding equipment and related products. Airgas is a leading U.S. producer of atmospheric gases with 16 air separation plants, a leading producer of carbon dioxide, dry ice, and nitrous oxide, one of the largest U.S. suppliers of safety products, and a leading U.S. supplier of refrigerants, ammonia products, and process chemicals.

Airgas was founded in 1982 by Executive Chairman Peter McCausland and became a publicly-traded company in 1986. Through strategic growth initiatives and more than 400 acquisitions, Airgas has become one of the premier industrial gas companies in the U.S., with an unparalleled packaged gas distribution platform. More than 15,000 employees work in approximately 1,100 locations, including branches, retail stores, gas fill plants, specialty gas labs, production facilities and distribution centers. Airgas also markets its products and services through eBusiness, catalog and telesales channels. Its national scale and strong local presence offer a competitive edge to its diversified customer base.

Currently Airgas has market capitalization of over $7.0 billion and a dividend yield of 1.59%. Last year the company had total revenues of around $5.0 billion and the profit margin is around 7.0%.

According to the company’s data, a $1,000 investment on Dec 19, 1986 would be worth $103,500.04 today with dividends reinvested yielding a superb return of 10,275.94%.

Also a $1,000 investment made on January 2, 2000 would be worth $ 12,662.55 for a return of 1,176.39% assuming dividends were reinvested.

Note: Dividend yields noted are as of Mar 1, 2013

Disclosure: No Positions