Auto-Parts Maker Genuine Parts Company Reaches 52-Week High

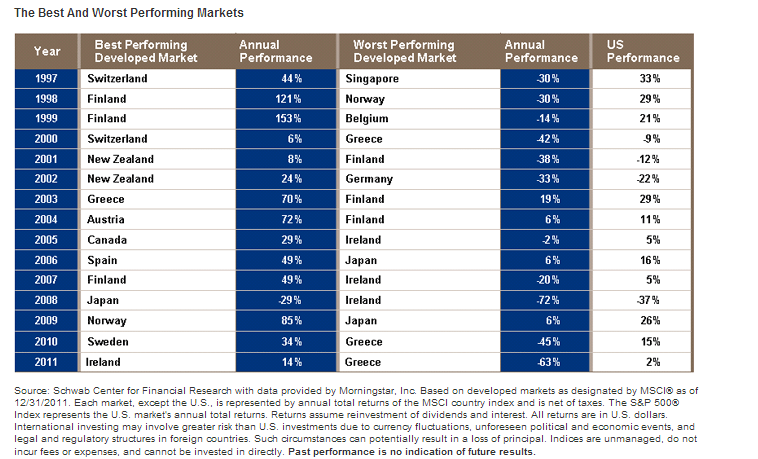
I wrote about auto parts makers back in January. Among the five big companies in this industry Genuine Parts Company(GPC) reached a 52-week high last week. From a low of about $25.00 in March 2009, the stock reached over $74 last week as shown in the chart below:

Click to enlarge

GPC-52-Week-High

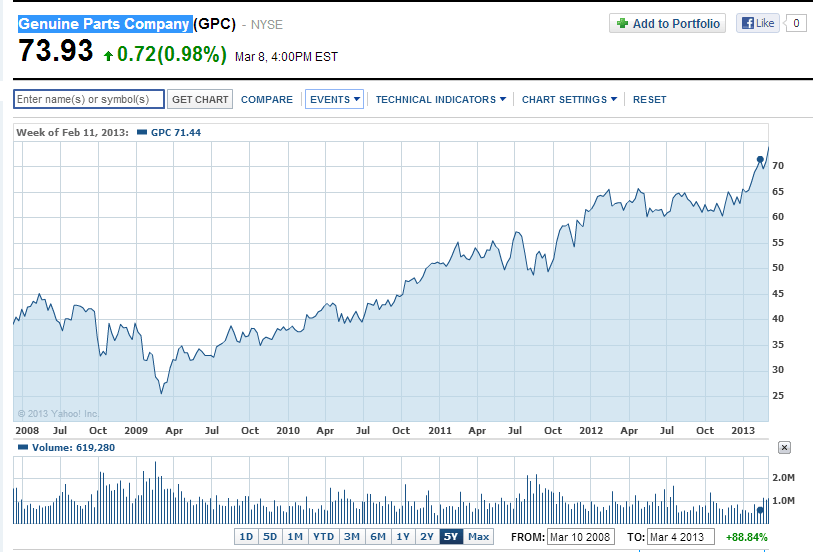
Source: Yahoo Finance

The company has over $11.0 B in market cap and has a current dividend yield of 2.91%. Other auto parts makers such as Magna International of Canada (MGA) also reported strong earnings recently. As auto sales have picked up since the credit crisis lows and continues to grow, auto parts makers are bound to grow as well. Hence despite the 52-week high GPC and others are worth adding at current levels.

It is interesting to note that GPC is one of the top holding in The AdvisorShares Global Alpha & Beta ETF (NYSE: RRGR) which is run by fellow blogger and portfolio manager Roger Nusbaum, CIO of Your Source Financial.

Note: Dividend yields noted are as of Mar 1, 2013

Disclosure: No Positions

Why Invest in Developed Markets Outside Of The US?

There are many reasons to invest in foreign stocks. In addition to emerging and frontier markets, U.S. investors should have exposure to other developed markets. This is is because companies in other developed countries operate differently with respect to management and other factors and their sales territory is not only limited to their home markets but may also include other markets. For example, many European multinationals such as Nestle(NSRGY), BP Plc (BP), BASF AG(BASFY), Unilever (UL, UN), Honda Motor Co (HMC), etc. have presence in many foreign countries in addition to their home markets. By investing in companies located in other developed countries U.S. investors can gain from their performance which can vary from the performance of their U.S. peers.

Another that should be noted is each developed country has its own unique advantages and disadvantages. Though most European countries struggled in recent years, Germany performed very well since the country’s economy is export-oriented and many German companies excel in their respective fields. For instance. German firms hold leadership positions in the global chemical industry. Though Singapore is a tiny city state, the country benefits strongly from its world-class trade, banking and tourism industries.Hence the economy of Singapore has different characteristics than the U.S. or European economies.  Similarly Australia and Canada are mostly resource-based economies compared to the U.S. economy which is highly diversified. So companies in these two countries may perform differently than U.S. companies.

The following table shows the U.S. equity performance against the performance of the best and worst developed markets from 1997 to 2011:

Click to enlarge

US-vs-Best-Worst-Devloped-markets-1

Source:  Why Invest Internationally?, July 24, 2012, Charles Schwab

During the dot-com boom of the late 90s, U.S. stocks yielded double digit returns in 1997, 1998 and 1999 which was good. However Switzerland returned 44% in 1997 outperforming the U.S. Finland returned an astonishing 121% and 153% in 1998 and 1999 which is much higher than the U.S. returns in the same years.

More recently in 2009 U.S. equities recovered from the global financial crisis lows to yield 26%. But Norway’s performance was even better with returns of 85%.

In 2012, the U.S. S&P 500 was up 13% while Germany’s DAX and Hong Kong’s Hang Seng rose by 22.5% and 20.2% respectively.

Related ETFs:

SPDR S&P 500 ETF (SPY)
iShares MSCI Germany Index Fund (EWG)
iShares MSCI Canada Index Fund (EWC)
iShares MSCI Australia Index Fund (EWA)
iShares MSCI United Kingdom Index (EWU)
iShares MSCI Singapore Index (EWS)

Disclosure: No Positions

A Short Review Of The Major Players Supplying The World Oil Market

One of the mysteries in the modern day world is the price of crude oil. Nobody really knows why the price of oil varies on a daily basis and why prices continue to go up. So it is not surprising that even the U.S. government’s Energy Information Administration states the following on its website: “The world oil market is complicated”. In this post lets take a quick look at this “complicated” market.

The two types of companies that dominate the world oil market are the International Oil Companies known as IOCs and the National Oil Companies called as NOCs. The IOCs are private companies while the NOCs are owned by governments. The NOCs control the majority of the world’s proven reserves and produced at least 55% of the world’s output in 2010. An example of IOC is Exxon Mobil and an example of NOC is Pemex of Mexico.

The following chart shows the share of the world’s oil production by type of company in 2011:

Click to enlarge

Top_Oil_Production-by-Type-of-Company-2011


Source: Who are the major players supplying the world oil market?, U.S. EIA

The U.S. has no NOCs. The entire oil market from exploration to production to distribution is in the hands of private companies who determine the price that the public pays at the pump. Some of these US-based IOCs include ExxonMobil (XOM), Chevron (CVX) and ConocoPhillips(COP). As these companies are private, they are only answerable to their shareholders and not the U.S. government.  The U.S. government cannot set the price of gasoline or interfere in the workings of these companies. Hence consumers are the mercy of these giant corporations when they fill gasoline for their cars and other vehicles. As these companies are responsible only to their shareholders who demand ever-higher returns and not to consumers or the government, price gouging at the pump occurs 24 hours a day on every day of the year right under the nose of the state.

The top three international oil companies by production in 2012 were Exxon Mobil, BP (BP), and Royal Dutch Shell (RDS-A, RDS-B). The top three NOCs based on production were Saudi Aramco, National Iranian Oil Company (NIOC) and PdVSA  of Venezuela .

The majority of the NOCs such as Saudi Aramco (Saudi Arabia), Pemex (Mexico), and PdVSA (Venezuela) are directly owned and operated as an extension of the government. All NOCs of the OPEC fall into this category. The goal of these NOCs is mainly to provide subsidized oil to the domestic consumers and generate revenue for the national governments by selling oil in the international market at market prices. Theoretically the states are supposed to use the oil wealth to help advance the country’s economy. Hence price of gasoline tend be very cheap relative to world prices in countries with these type of NOCs. As the government sets the price of oil in these countries, the price of gasoline does not vary based on the international market prices.

The second type of NOC are the ones which do not operate as an agency of the government but operate as a corporate entity. They try to satisfy both the profit-motives of a private corporation and further the goals of the country. The state may hold a major stake in these companies in order to have some control over how they are run. Statoil (STO) of Norway and Petrobras (PBR) of Brazil are example of such as NOCs.

OPEC:

Organization of the Petroleum Exporting Countries (OPEC) is a group of some of the the world’s most oil-rich countries.  They control about 70% of the world’s proven oil reserves. In its simplest form the OPEC can be considered as a cartel. Though the formation of cartels is illegal in most countries in all industries, the OPEC has been allowed to form and operate as a cartel. The OPEC controls the production, prices of oil and other matters related to oil. So just like any cartel, its job is to make sure that prices stay at a specific level to generate enough profits are determined by the member countries. So for example, if the price of oil falls because the world’s demand is down, the OPEC cuts production to bring up the price to the level it desires.

The 12 member of the OPEC are Iran, Iraq, Kuwait, Saudi Arabia, Qatar, United Arab Emirates, Algeria, Angola, Ecuador Libya, Nigeria and Venezuela. Ecuador and Venezuela are the only OPEC countries in the Western Hemisphere.

So one reason that can be attributed as to why the world’s oil market is complicated is that the OPEC cartel is allowed to exist to manipulate prices. One can only wonder why Western powers are unwilling to apply the the principles of free-market to the oil industry and force the dismantling of the OPEC.

Disclosure: No Positions

Gross Debt Levels in Select Countries 2012

The global financial crisis exposed the big flaw in debt-led growth in most developed countries. The U.S. became the poster child for the world see the harmful effects of how unsustainable debt levels held by individuals, companies and governments alike. Even after the credit crisis debt levels remain still high in many countries. For example, at the end of last year U.S. gross debt stood at 370% of the GDP.This figure includes all the four types of debt shown in the chart below.

The U.S. economy was about $14.0 Trillion in 2011. To put the U.S. Federal government debt in perspective, the total outstanding U.S. public debt is $16,701,250,641,109.6 as of March 7, 2013. Out of  this figure, $11.8 Trillion is held by the public and the rest are intra-governmental holdings according data by the U.S. Treasury Department. The U.S. is the largest debtor country in the country and China holds the largest amount of U.S. debt. Nobody knows if this debt will ever be paid to Chinese. The only thing that everyone seem to focus is on for the time being is the interest paid out to the Chinese and other countries every year. Since this interest is only a few billion dollars the U.S. is easily able to pay it without any worries about the principal amount of the loans.

As a result of the sovereign debt crisis in European countries such as Spain, Italy, Portugal and Greece, temporary solutions have been implemented in the past few years to avoid the collapse of the Euro. However debt held by private individuals and corporations have not been reduced much. For example, Spanish households and financial institutions continue to hold high levels of debt from their exposures to the once-vibrant real estate industry.

Niels Jensen of Absolute Return Partners LLP of UK shared some of his thoughts on the debt levels in developed countries in their latest report. From the article:

Overall debt levels remain excruciatingly high (chart 1) and I note with some trepidation that Greece is not even close to being the most indebted nation in the world today. In chart 1 debt from all the four main sectors of the economy have been added together. As experience has taught us, it is total debt that matters. Focusing on government debt alone will lead to bad investment decisions.

Click to enlarge

Gross-Debt-by-Countries-2012

Without a healthy level of economic growth there is no way that all this debt can ever be repaid, hence the growing focus on nominal GDP growth, so, in that respect, economic growth still matters.

Source: Expect the Unexpected by Niels C. Jensen, The Absolute Return Letter, March 2013
Absolute Return Partners LLP, UK

Performance of KBW Bank Indices vs. S&P 500 Index

The latest Fed Stress Tests of US banks indicate that 17 of the largest 18 banks could withstand a deep recession and maintain enough capital above the minimums required. Ally Financial(ALLY), the car lending company that used to part of GM is the only odd man out in the Fed’s tests. The final results will be made public on March 14th together with the Fed’s decision on banks’ request to increase dividends or share buybacks.

From a Bloomberg article today:

U.S. banks have grown stronger since the crisis. The Fed said in November the largest banking groups had nearly doubled their Tier 1 common capital to $803 billion in the second quarter of last year from $420 billion in the first quarter of 2009.

The KBW Bank Index (KBX), which tracks shares of 24 large U.S. banks such as JPMorgan,State Street Corp. (STT) and Capital One, has risen 9.7 percent this year, compared with the 8.3 percent gain of the Standard & Poor’s 500 Index.

The Fed for the test gave banks 26 variables — ranging from interest rates to stock and home-price indexes — and showed how they would change over time. The Fed also gave banks an adverse scenario with rising interest rates and a baseline scenario, and didn’t disclose the results for these.

The KBW Bank Index (BKX) is leading the S&P 500 year-to-date as noted above. However the KBW Regional Bank Index (KRE) is over 11% compared to KBW Bank Index’ return of over 9% as shown in the ETF charts for these indices below:

Click to enlarge

SP500-vs-Bank-Indices-YTD-1

Source: Google Finance

The KBW Regional Bank Index (KRE) is composed of about regional banks such as Bank of Hawaii(BOH), Susquehanna Bancshares (SUSQ), First Horizon National Corp (FHN), etc.

In the 5-years both the bank indices have lagged the performance of the S&P 500 due to the big crash in banking shares during the financial crisis. While the S&P is up about 20% the regional bank index and the bank index are down about 10% and 27% respectively. Here again the regionals have performed better than the large banks.

SP500-vs-Bank-Indices-5-Years

Related ETFs:

  • SPDR S&P 500 ETF (SPY)
  • SPDR KBW Bank ETF (KBE)
  • SPDR KBW Regional Banking ETF (KRE)

Disclosure: No Positions