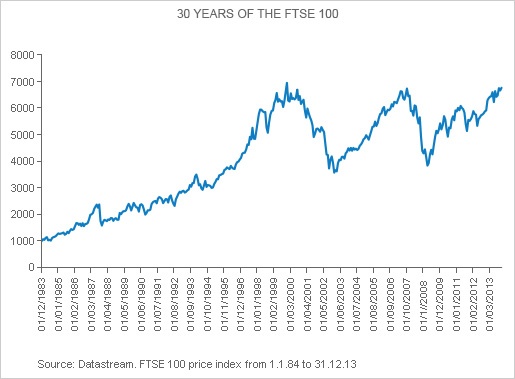
The FTSE 100 turns thirty this year. With a base level of 1000, it was launched in January 1984 as a broader measure of the corporate British economy.
The chart below shows the performance of the index over the past 30 years:
Click to enlarge
Source: FTSE 100 turns thirty, Fidelity UK
On Friday the FTSE 100 closed at 6,829.30.
A few points of interest from the Fidelity article are listed below:
- In the first 17 years of its existence the FTSE had strong returns. But this could not be repeated in the next 13 years.
- The Footsie came just in time to capture the investing mood of a generation when wide-scale privatization of state industries led millions of Britons to own shares in the years that followed.
- By some measures the index does not represent the broad British economy. For example, Persimmon is the only UK home builder in the index whereas the next seven large builders are in the FTSE 250 index.
- The FTSE also suffers from “survivor bias” since failing companies are routinely booted out and replaced by successful firms.
- The original constituents of the FTSE 100 reflected Britain as a manufacturing powerhouse with long-established names such as BICC (electrical cables) Courtaulds (textiles) and TI Group (steel tubing) among them.
- Some of the original constituents such as BP (BP), Marks & Spencer(MAKSY) and Unilever(UL) are still in the index today.
The table below shows the original members of the FTSE 100 in 1984 and what happened to them:
| S.No. | Original Member | What happened to it |
|---|---|---|
| 1 | Allied-Lyons | Acquired |
| 2 | Associated British Foods (LSE: ABF) | |
| 3 | Associated Dairies | Acquired |
| 4 | British American Tobacco (LSE: BATS) | |
| 5 | BICC | Balfour Beatty |
| 6 | BOC | Acquired |
| 7 | BPB Industries | Acquired |
| 8 | BTR | Now called Invensys (LSE: ISYS) |
| 9 | Barclays (LSE: BARC) | |
| 10 | Barratt Developments | Now in the FTSE 250 |
| 11 | Bass | Broken up |
| 12 | Beecham | Acquired |
| 13 | Berisford (S&W) | Acquired |
| 14 | Blue Circle Industries | Acquired |
| 15 | Boots | Acquired |
| 16 | British Aerospace | Now called BAE Systems (LSE: BA) |
| 17 | British & Commonwealth Shipping | Bankrupt |
| 18 | British Electric Traction | Acquired |
| 19 | British Home Stores | Acquired |
| 20 | BP (LSE: BP) | |
| 21 | Britoil | Acquired |
| 22 | Bowater | Now called Rexam (LSE: REX) |
| 23 | Burton | Acquired |
| 24 | Cable & Wireless (LSE: CW) | |
| 25 | Cadbury Schweppes | Now just Cadbury (LSE: CBRY) |
| 26 | Charterhouse J. Rothschild | Broken up |
| 27 | Commercial Union Assurance | Now called Aviva (LSE: AV) |
| 28 | Consolidated Gold Field | Acquired |
| 29 | Courtaulds | Acquired |
| 30 | Dalgety | Broken up |
| 31 | Distillers | Acquired |
| 32 | Edinburgh Investment Trust | Now in the FTSE 250 |
| 33 | English China Clays | Acquired |
| 34 | Exco International | Acquired |
| 35 | Ferranti | Bankrupt |
| 36 | Fisons | Acquired |
| 37 | General Accident Fire & Life | Acquired |
| 38 | General Electric | Acquired |
| 39 | Glaxo | Now called GlaxoSmithKline (LSE: GSK) |
| 40 | Globe Investment Trust | Acquired |
| 41 | Grand Metropolitan | Merged with Guinness, now called Diageo (LSE: DGE) |
| 42 | GUS | Broken up |
| 43 | Guardian Royal Exchange | Acquired |
| 44 | Guest, Keen & Nettlefolds | Now just GKN (LSE: GKN) and in the FTSE 250 |
| 45 | Hambro Life Assurance | Acquired |
| 46 | Hammerson (LSE: HMSO) | |
| 47 | Hanson Trust | Acquired |
| 48 | Harrisons & Crosfield | Elementis/FTSE Small Cap |
| 49 | Hawker Siddeley | Acquired |
| 50 | House of Fraser | Acquired |
| 51 | ICI | Acquired, but demerged AstraZeneca (LSE: AZN) in 1993. |
| 52 | Imperial Continental Gas | Broken up |
| 53 | Imperial | Now Imperial Tobacco (LSE: IMT) |
| 54 | Johnson Matthey (LSE: JMAT) | |
| 55 | Ladbrokes | Now in the FTSE 250 |
| 56 | Land Securities (LSE: LAND) | |
| 57 | Legal & General (LSE: LGEN) | |
| 58 | Lloyds Bank | Now Lloyds Banking Group (LSE: LLOY) |
| 59 | MEPC | Acquired |
| 60 | MFI Furniture | Bankrupt |
| 61 | Magnet & Southerns | Acquired |
| 62 | Marks & Spencer (LSE: MKS) | |
| 63 | Midland Bank | Acquired |
| 64 | National Westminster Bank | Acquired |
| 65 | Northern Foods | Now in the FTSE 250 |
| 66 | Pearson (S) & Son | Now called Pearson (LSE: PSON) |
| 67 | Peninsular & Oriental Steam | Acquired |
| 68 | Pilkington Brothers | Acquired |
| 69 | Plessey | Acquired |
| 70 | Prudential Assurance | Now just Prudential (LSE: PRU) |
| 71 | RMC | Acquired |
| 72 | Racal Electronics | Acquired, although demerged Vodafone (LSE: VOD) in 1988. |
| 73 | Rank Organisation | Acquired |
| 74 | Reckitt & Colman | Now called Reckitt Benckiser (LSE: RB) |
| 75 | Redland | Acquired |
| 76 | Reed International | Now called Reed Elsevier (LSE: REL) |
| 77 | Rio Tinto-Zinc | Now called Rio Tinto Group (LSE: RIO) |
| 78 | Rowntree-Mackintosh | Acquired |
| 79 | Royal Bank of Scotland (LSE: RBS) | |
| 80 | Royal Insurance | Now called RSA (LSE: RSA) |
| 81 | J Sainsbury (LSE: SBRY) | |
| 82 | Scottish & Newcastle Breweries | Acquired |
| 83 | Sears | Broken up |
| 84 | Sedgwick | Acquired |
| 85 | Shell Transport & Trading | Now called Royal Dutch Shell (LSE: RSDB) |
| 86 | Smith & Nephew (LSE: SN) | |
| 87 | Standard Chartered (LSE: STAN) | |
| 88 | Standard Telephone & Cable | Acquired |
| 89 | Sun Alliance & London Insurance | Acquired |
| 90 | Sun Life Assurance Society | Acquired |
| 91 | Tarmac | Acquired |
| 92 | Tesco (LSE: TSCO) | |
| 93 | Thorn EMI | Acquired |
| 94 | Trafalgar House | Acquired |
| 95 | Trusthouse Forte | Acquired |
| 96 | Ultramar | Acquired |
| 97 | Unilever (LSE: ULVR) | |
| 98 | United Biscuits | Acquired |
| 99 | Whitbread (LSE: WTB) | |
| 100 | George Wimpey | Now called Taylor Wimpey (LSE: TW) and in the FTSE 250 |
Data Source: Motely Fool, UK
The history of the FTSE 100 constituent changes over the years can be found here.
Unlike the original FTSE, the current version is composed of fewer manufacturing firms.The FTSE 100 currently is dominated by banking, mining and energy firms.Today it is a market-capitalisation weighted index of UK-listed blue chip companies measuring the performance of the 100 largest companies traded on the London Stock Exchange that pass screening for size and liquidity.
The dividend yield of the index stood 3.46% at the end of 2013 (in local currency terms) and the top 10 constituents accounted for about 43% of the index market capitalization.
The Top Five Constituents of the Index are listed below with their current dividend yields:
1.Company: HSBC Holdings (HBC)
Current Dividend Yield: 4.31%
Sector: Banking
2.Company:Vodafone Group (VOD)
Current Dividend Yield: 4.05%
Sector: Telecom
3.Company: BP Plc (BP)
Current Dividend Yield: 4.54%
Sector:Oil & Gas Producers
4.Company: Royal Dutch Shell A (RDS-A)
Current Dividend Yield: 4.29%
Sector:Oil & Gas Producers
5.Company: GlaxoSmithKline (GSK)
Current Dividend Yield: 4.38%
Sector:Pharmaceuticals & Biotechnology
The full list of FTSE 100 can be found here.
Note: Dividend yields noted above are as of Jan 17, 2014. Data is known to be accurate from sources used.Please use your own due diligence before making any investment decisions.
Source: FTSE
The iShares MSCI United Kingdom ETF (EWU) which tracks the MSCI United Kingdom Index gives exposure to some of the large British firms. It has a 12-month yield of 2.40%.
Disclosure: No Positions
Update:
The changing face of the FTSE 100, CityWire UK