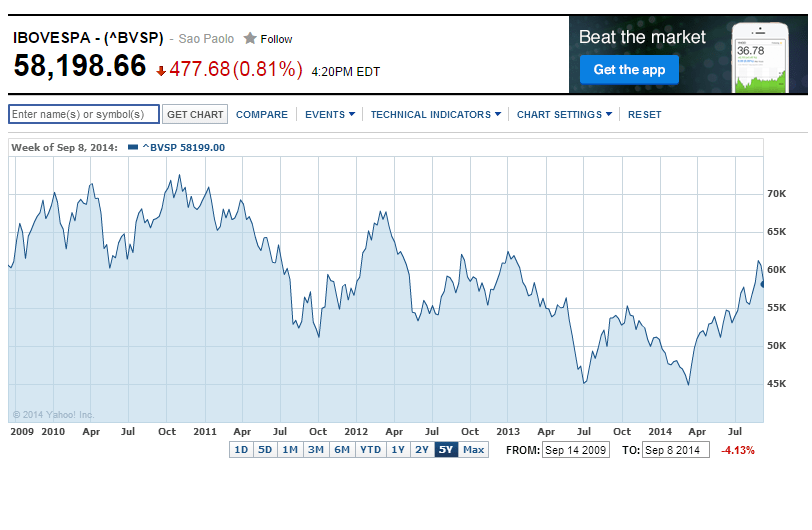
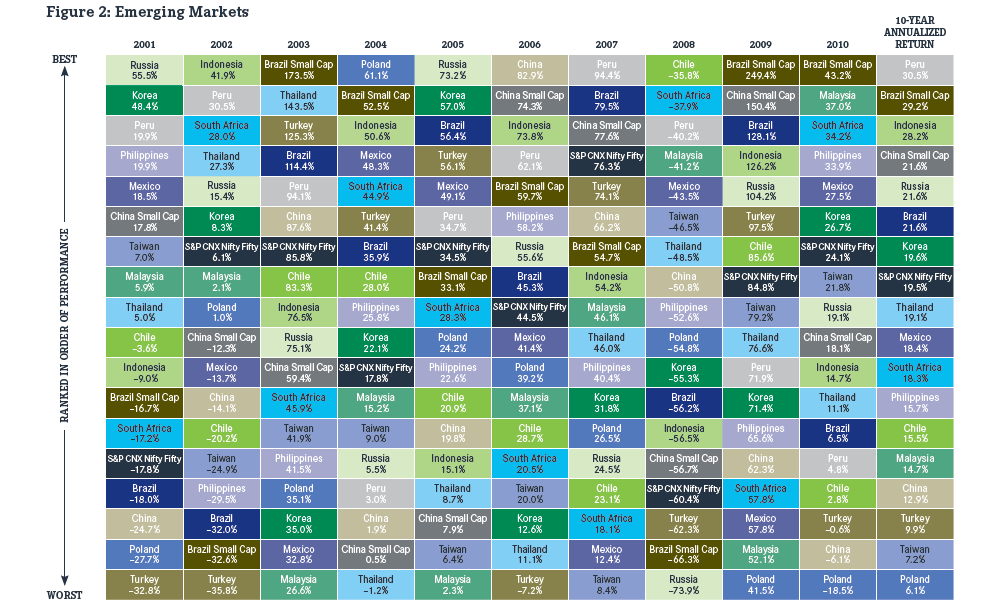
The Brazilian equity market has been very volatile in the past few weeks due to the upcoming general elections in October. Brazil used to be the top destination for emerging market investors up until a few years ago. Equity investors enjoyed spectacular returns when the Brazilian market as hot. For example, from 2001 to 2010 the 10-year annualized return for Brazil was 21.6%. Though Brazil plunged over 56% during the peak of the global financial crisis in 2008, the following year it soared by 128%. From 2003 to 2007, Brazilian stocks yielded double digit percentage returns. However as the global commodity market cooled in the past few years and government policies became anti-investor friendly, global investors fled Brazilian equities.
The Bovespa is up by 10.5% so far this year as investors bet on a change in political reforms and policies. Though most Brazilian ADRs fell on Friday, year-to-date some of the ADRs are in the positive territory as shown in the chart below:
Click to enlarge
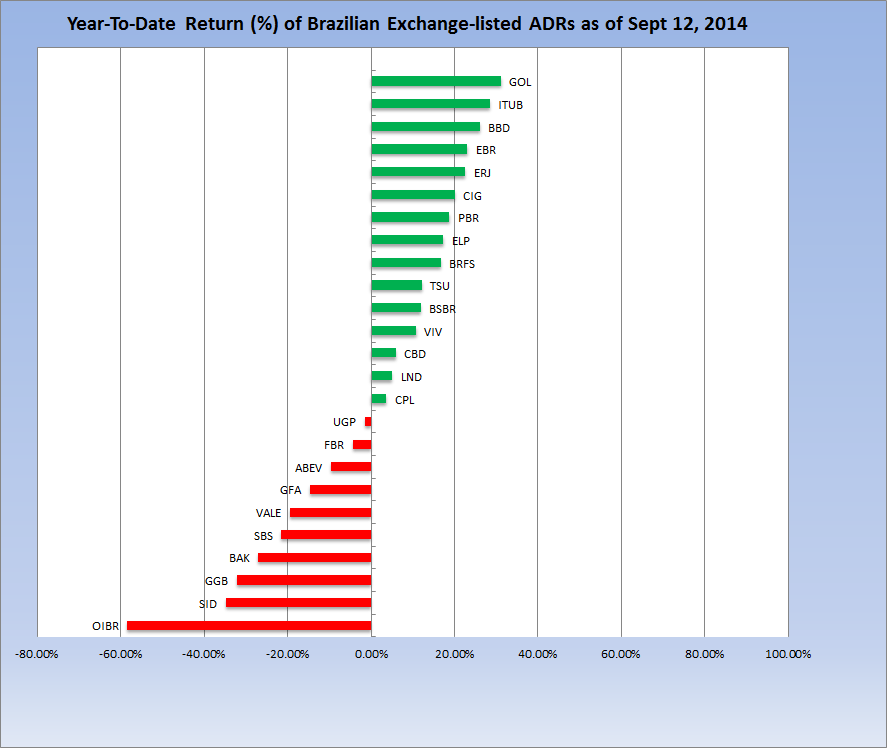
Data Source: BNY Mellon
Miners and some utilities such as Sabesp (SBS) are down year-to-date while banks such as Itau (ITUB), Banco Bradesco (BBD) are up by over 20%. Though Petrobras (PBR) is up this year, it still has a long way to go to reach the highs reached in the recent past. It would be interesting to how the equity market reacts once the elections are over and a new administration takes power.
Disclosure: Long PBR, BBD, ITUB