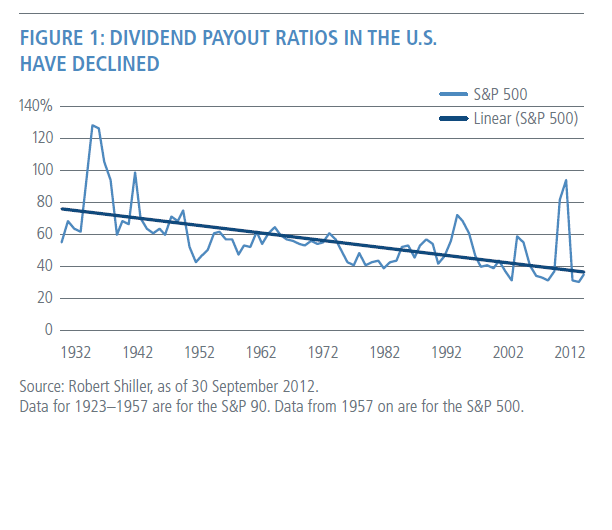
Download: Credit Suisse Global Investment Returns Yearbook 2014

Every year Credit Suisse publishes their famous Global Investment Returns Yearbook. This year’s version was released back in February. This year’s report includes many fascinating charts and facts. The entire report is worth a review.

Below are some sample charts from the Credit Suisse Global Investment Returns Yearbook 2014:

1) Relative size of World Stock Markets at the end of 1899 and 2013

Click to enlarge

World Stock Market Sizes in 1899 and 2013

At the beginning of the 20th century the UK’s equity market size was one-fourth of the total global equity market. With the loss of most of it colonies in the early 1900s British power and influence declined. Accordingly the dominance of British companies also declined.

2) Emerging and Developed Markets’ Equity Returns by Decade

Emerging and Developed Markets Returns By Decade

You can download the full report by clicking on the image below or here.


Credit-Suisse-Global-Investment-Returns-Yearbook-2014Source: Credit Suisse Research Institute

You can find the 2013 Yearbook  here.


Protection of Permanent Workers Against Individual Firing in Select Countries

In the developed world protection of permanent workers against individual dismissal is generally very high in Europe. However some emerging countries have better protection for workers than in Europe as shown in the chart below:

Click to enlarge

Worker Protection by Country

Source: Containting costly job losses, OECD Observer

According to OECD, India has the highest protect for permanent workers while the U.S. has the lowest. In fact, India labor laws for permanent workers is stricter than China’s.

From an article in Knowledge@Wharton from Wharton School of the University of Pennsylvania:

India’s labor laws — largely unchanged from how the British wrote them — have a negative view of private sector employers. This view believes that all employers are exploiters; that most employees have no alternative employment options; that most employers are big companies, and that shareholders pay salaries not customers. This has led to four painful defects in India’s labor market: 12% manufacturing employment (the same as the post-industrial U.S.), 50% agricultural employment (240 million Indian produce less food than four million Americans), 50% self-employment (the poor cannot afford to be unemployed, so they are subsistence self-employed), and 90% informal employment (100% of net job creation since 1991 has happened informally.)

India’s labor laws are a mess. It is practically impossible to comply with 100% of them without violating 10% of them. Most employment contracts are marriages without divorce; on paper you can’t get rid of an employee once you have hired him or her. (emphasis added)

Source: Why the New Labor Law Reforms Make India Fertile for Jobs, Knowledge@Wharton

I is interesting that Russia ranks higher than even France in worker protection. However it must be noted that Russia until a few decades ago was a communist country and laws were created that favored workers. Even today the majority of the workforce in Russia work in the public sector and the state is the largest employer.

It should be noted that since hiring and firing of both temporary and permanent workers is easy in the U.S., the American economy is the most vibrant economy in the world. American employers hire workers when demand picks up for their products or services and fire or lay them off during periods of slack demand. This is not possible in most of the countries shown in the above chart. Hence workers stay on a company’s payroll sometimes for years as it is difficult for employers to get rid of them.

Related: Factbox: India’s stringent labor laws, Reuters

Five Large-Cap Foreign Companies To Consider Instead of Their U.S. Peers

The dividend yield of the S&P 500 has stayed at around 2% for many years.Investors looking for higher yields can consider foreign equities many of which have much higher dividend yields.Traditionally European companies tend to have higher dividend yields than U.S. firms.

Despite withholding taxes on dividends imposed on U.S. investors by most foreign governments and other factors, its still possible to earn higher dividend income by investing in foreign companies than their U.S. counterparts. In this post lets a take a look at how the dividend yield of five large-cap foreign companies compares with their U.S. peers.

1. The current dividend yield of  French oil major Total SA (TOT) is 5.22%. Some of its U.S. peers such as Exxon Mobil Corp (XOM) and Chevron Corp (CVX) have yields of only 2.77% and 3.31% respectively.

2.The American tobacco giants Lorillard Inc(LO) has a dividend yield of 4.12%.The equivalent British company Imperial Tobacco Group PLC (ITYBY) has a yield of 4.56%.

3.British mobile telecom giant Vodafone Group PLC (VOD) has a dividend yield of 6.83% compared to AT&T Inc(T)’s 5.26% and Verizon Communications Inc’s(VZ) 4.26%.

4.American food companies Kellogg Co(K) and General Mills Inc(GIS) have dividend yields of 3.02% and 3.07% respectively.Their Swiss peer Nestle SA pays a dividend of 3.12%.

5.US chemical makers E I du Pont de Nemours and Co(DD) and Dow Chemical Co(DOW) 2.84% and 2.76% respectively.However their German peer BASF SE(BASFY) has a dividend yield of 3.64%.BASF is the world’s largest chemical company.

Please note that I have selectively picked the above examples. We can find foreign companies that have dividend yields that are the same or even lower than that of U.S. firms. The point here is to emphasize the importance of looking abroad for dividend income.Withholding taxes on foreign dividends may wipe out any gains due to the higher dividend yields of foreign companies. However some countries such as Canada waive the tax if the security is held in qualified retirement accounts such as 401(k), Traditional and Roth IRAs, etc.

Note: Dividend yields noted above are as of Aug 29, 2014. Data is known to be accurate from sources used.Please use your own due diligence before making any investment decisions.

Disclosure:  Long GIS

Can the U.S. Become the Top Exporter of Manufactured Goods ?

The U.S. economy is the world’s largest economy with an GDP of over $16.0 Trillion. However much of the U.S. economy output  is derived from the service sector not manufacturing of goods. Service sectors includes everything from flipping burgers at a fast food store to preparing taxes for a customer to creating and shuffling paperwork around like derivatives on Wall Street and everything in between that does not involve producing any actual product. We can also consider the U.S. economy as a consumption-based economy since the U.S. is the largest consumer of goods in the world. But the majority of goods consumed especially consumer goods are produced overseas by other countries.

The following chart from an article on U.S. manufacturing  in The Wall Street Journal shows the annual exports of manufactured goods by the world’s top exporters:

Click to enlarge

Annual Exports of Manufactured Goods for Select Countries

Source:  Why U.S. Manufacturing Is Poised for a Comeback (Maybe),  The Wall Street Journal, June 1, 2014

Here are two interesting stats from the article:

In 2013, the U.S. had $470 billion deficit in trade of manufacturing goods while Germany had a surplus of $437 billion. China’s surplus stood at an astonishing $866 billion.

The manufacturing industry accounts for just 8.8% of the total employment in the U.S. at the end of last year.

Some of the positive factors that support a revival of  manufacturing in the U.S. are:

  • Availability of cheap energy such as electricity and natural gas.
  • Vast pool of world-class top quality talent in every field from biotechnology to engineering.
  • Almost unlimited amount of funding available for research and investment from government and the private sector.
  • Huge amounts of land and other resources such as water available for building factories.
  • Good transportation infrastructure.
  • Cheap labor costs compared to other developed countries as the majority of U.S. labor is non-union.

Some of the negative factors that prevents a revival of  manufacturing in the U.S. are:

  • Complicated and unfavorable tax codes include the highest tax rate for corporations.
  • Excessive and burdensome government regulations.
  • All types of infrastructure needs a badly needed upgraded. This include the electricity grid, road, railroads, airports, internet, cell phone network, etc. For example, U.S. airports and internet connectivity speeds are pathetic compared to even some third-world countries.
  • Labor costs are high relative to emerging countries due to excess supply of labor in those countries. Despite millions of Americans unemployed now and thousands of illegals pouring into the country, labor costs will always be higher here than in China, Brazil, South Africa, etc.

In summary, the U.S. can compete and become the world’s biggest exporter of  manufactured goods provided policies are reformed to encourage manufacturers to stay home as opposed to fleeing to abroad. Otherwise despite the hype about the growth of U.S. oil and natural gas industry growth due to fracking, cheap electricity and other factors,  the U.S will continue to be a service-based economy and will never retain the title of world’s top goods exporter.

A related note:

A interesting Bloomberg BusinessWeek article recently discussed China’s manufacturing investments in Africa. China’s Huajian Shoes company operates a factory outside Addis Ababa in Ethiopia. Huajian is a supplier of top brand names like Nine West and Guess.Compared to employing a Chinese worker in China the company finds Ethiopian workers much cheaper. While Chinese workers make about $400 per month stitching shoes whereas an Ethiopian workers does the same job for just $40 a month. As business grows Huajian plans to increase its workforce in the factory to about 50,000 in eight years.

From the BusinessWeek article:

China Africa Investments

Huajian’s 3,500 Ethiopian workers produced 2 million pairs of shoes last year. Located in one of the country’s first industrial zones—which offer better infrastructure and tax exemptions—the factory began operating in January 2012. It became profitable its first year and now makes $100,000 to $200,000 a month, Zhang says—an insufficient return that he claims will rise as workers become better trained. Beneath bright fluorescent lights and amid the drone of machines, workers cut, glue, stitch, and sew Marc Fisher leather boots destined for the U.S. market. Supervisors monitor quotas on whiteboards, giving small cash rewards to winning teams and criticizing those who fall short.

Source: Turning Ethiopia Into China’s China,Bloomberg BusinessWeek, July 14, 2014

Royal Bank of Scotland Stock Is Dead Money

The Royal Bank of Scotland Group (RBS) started trading on the NYSE in late 2007. Since then the stock has been as disaster for investors. The global financial crisis crushed RBS. But while other global banks have recovered since then RBS stock continues to be dead money.

The long-term chart below shows the disaster that is Royal Bank of Scotland:

Click to enlarge

RBS Long Term

Source: Yahoo Finance

RBS is down over 97% for the period shown. The last time the bank paid any dividend was in May 2008. 

In November, 2008 the bank implemented a 1 for 20 reverse split. Even after that split the stock price has plunged and continues to struggle. The stock price has practically gone nowhere in the past few years.

Investors waiting for a turnaround can consider taking the losses and move on to other alternatives.

Disclosure: No positions