Investing in foreign stocks involves many risks one of which is currency risk. While most currencies of developed countries remain stable in relation to the US dollar there is still the risk that currency exchange movements can reduce returns earned from equities. Unlike emerging or frontier markets investors in developed countries need not worry about dramatic devaluation almost overnight or other extreme scenarios.
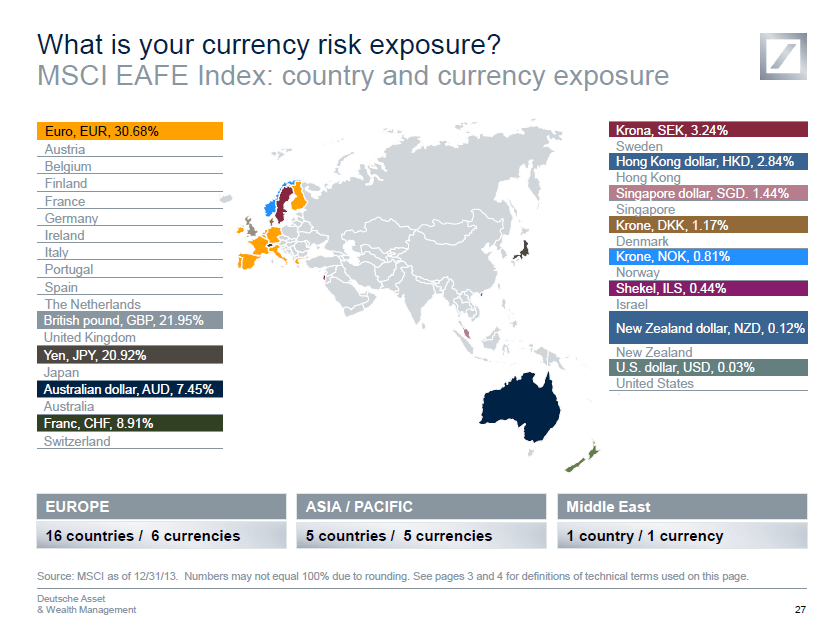
Lets review the impact of currency risks using the MSCI EAFE Index which measures the performance of developed equities outside of the U.S. and Canada. The iShares MSCI EAFE Index (EFA) ETF tracks the performance of this index and has net assets of over $54.0 billion. It is one of the largest ETFs out there in terms of assets as it provides a simply way to access developed markets outside of U.S. and Canada.Investors in this ETF and other funds that track the index will be exposed to many currencies such as the Swedish Krona, Japanese Yen, Euro, Australian dollar, etc. For the 22 countries in the index investors will be exposed to 12 different currencies risks as shown in the graphic below:
Click to enlarge
Currency exchange movements affect the total return on an investment in foreign equities. In some years this impact can be significant when compare to equity returns. The following chart shows the contribution of currency effects to the MSCI EAFE Index by year from 1983 to 2013:
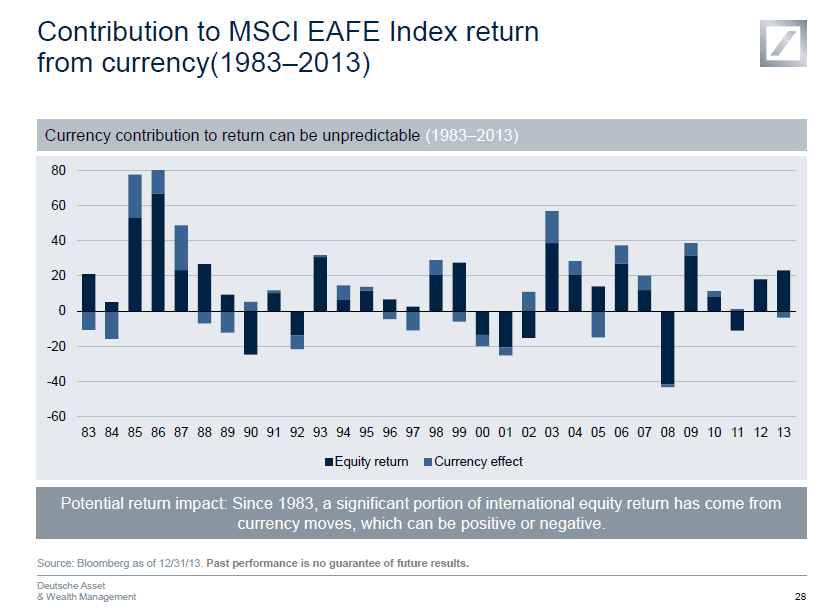
Source: Managing risk factors to build a better portfolio, Deutsche Asset & Wealth Management
Related ETFs:
Disclosure: No Positions
Test: