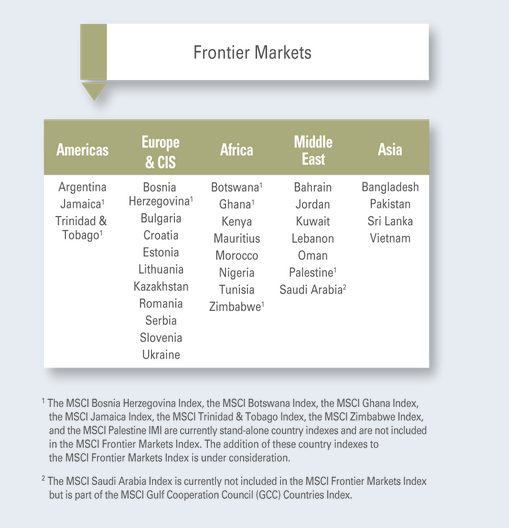
Frontier markets are markets that are considered less developed than emerging markets. These markets include countries such as Sri Lanka, Ghana, Ukraine, etc. Of the 33 countries that MSCI classifies as frontier markets 24 are included in the MSCI Frontier Markets Index.
The major index provider classifies the following markets as Frontier markets:
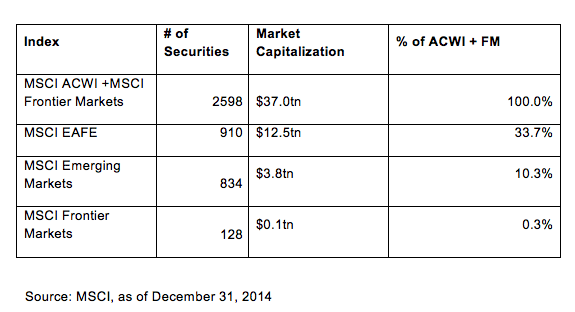
Click to enlarge
These equity markets are very tiny compared to global markets and they are not suitable for all investors. Stocks in these markets are very illiquid, information on them are hard to find, can be very volatile, etc.
In terms of performance, the MSCI Frontier Markets index has outperformed the MSCI Emerging Markets index in the past five years. However it has lagged the returns of the indices for Developed markets of North America and Europe as the chart shows below:
Click to enlarge
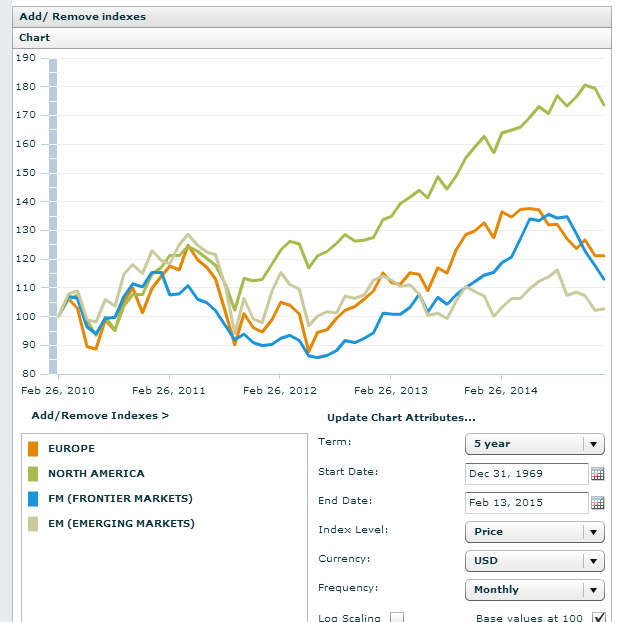
Source: MSCI
This shows that frontier markets investing returns is not much better than emerging markets in terms of performance. Of course, they are nowhere near the performance of developed markets. Global investors prefer developed markets and they command a premium over frontier and emerging markets. For example, one cannot even compare the FTSE index and the liquidity of stocks on the London Stock Exchange to a frontier market like Morocco or Jamaica.
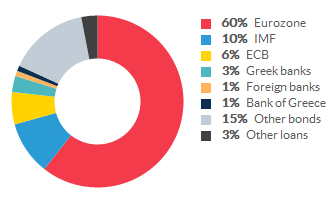
Investors willing to take huge risks can allocate a tiny portion of their portfolio to frontier markets. Since investing in individual stocks are difficult one way to easily invest in these markets is via the iShares MSCI Frontier 100 ETF (FM). The ETF tracks the performance of the 100 of the largest frontier market stocks represented in the MSCI Frontier Markets 100 Index. Hence it has 100 holdings and is the largest of the frontier market ETFs with an asset base of over $569 million. The fund was started in late 2012 and has a distribution yield of 1.05%.
With a portfolio weightage of over 26%, the fund is highly concentrated with stocks from Kuwait. Argentina and Pakistan together with Kuwait account for over 50% of the portfolio allocations. Year-to-date the ETF is down by 2.34%.
MorningStar published an research report “Frontier Markets Begin To Emerge” in December, 2014. Investors interested in these markets may want to read the report in full which can be found here(in pdf).
Update:
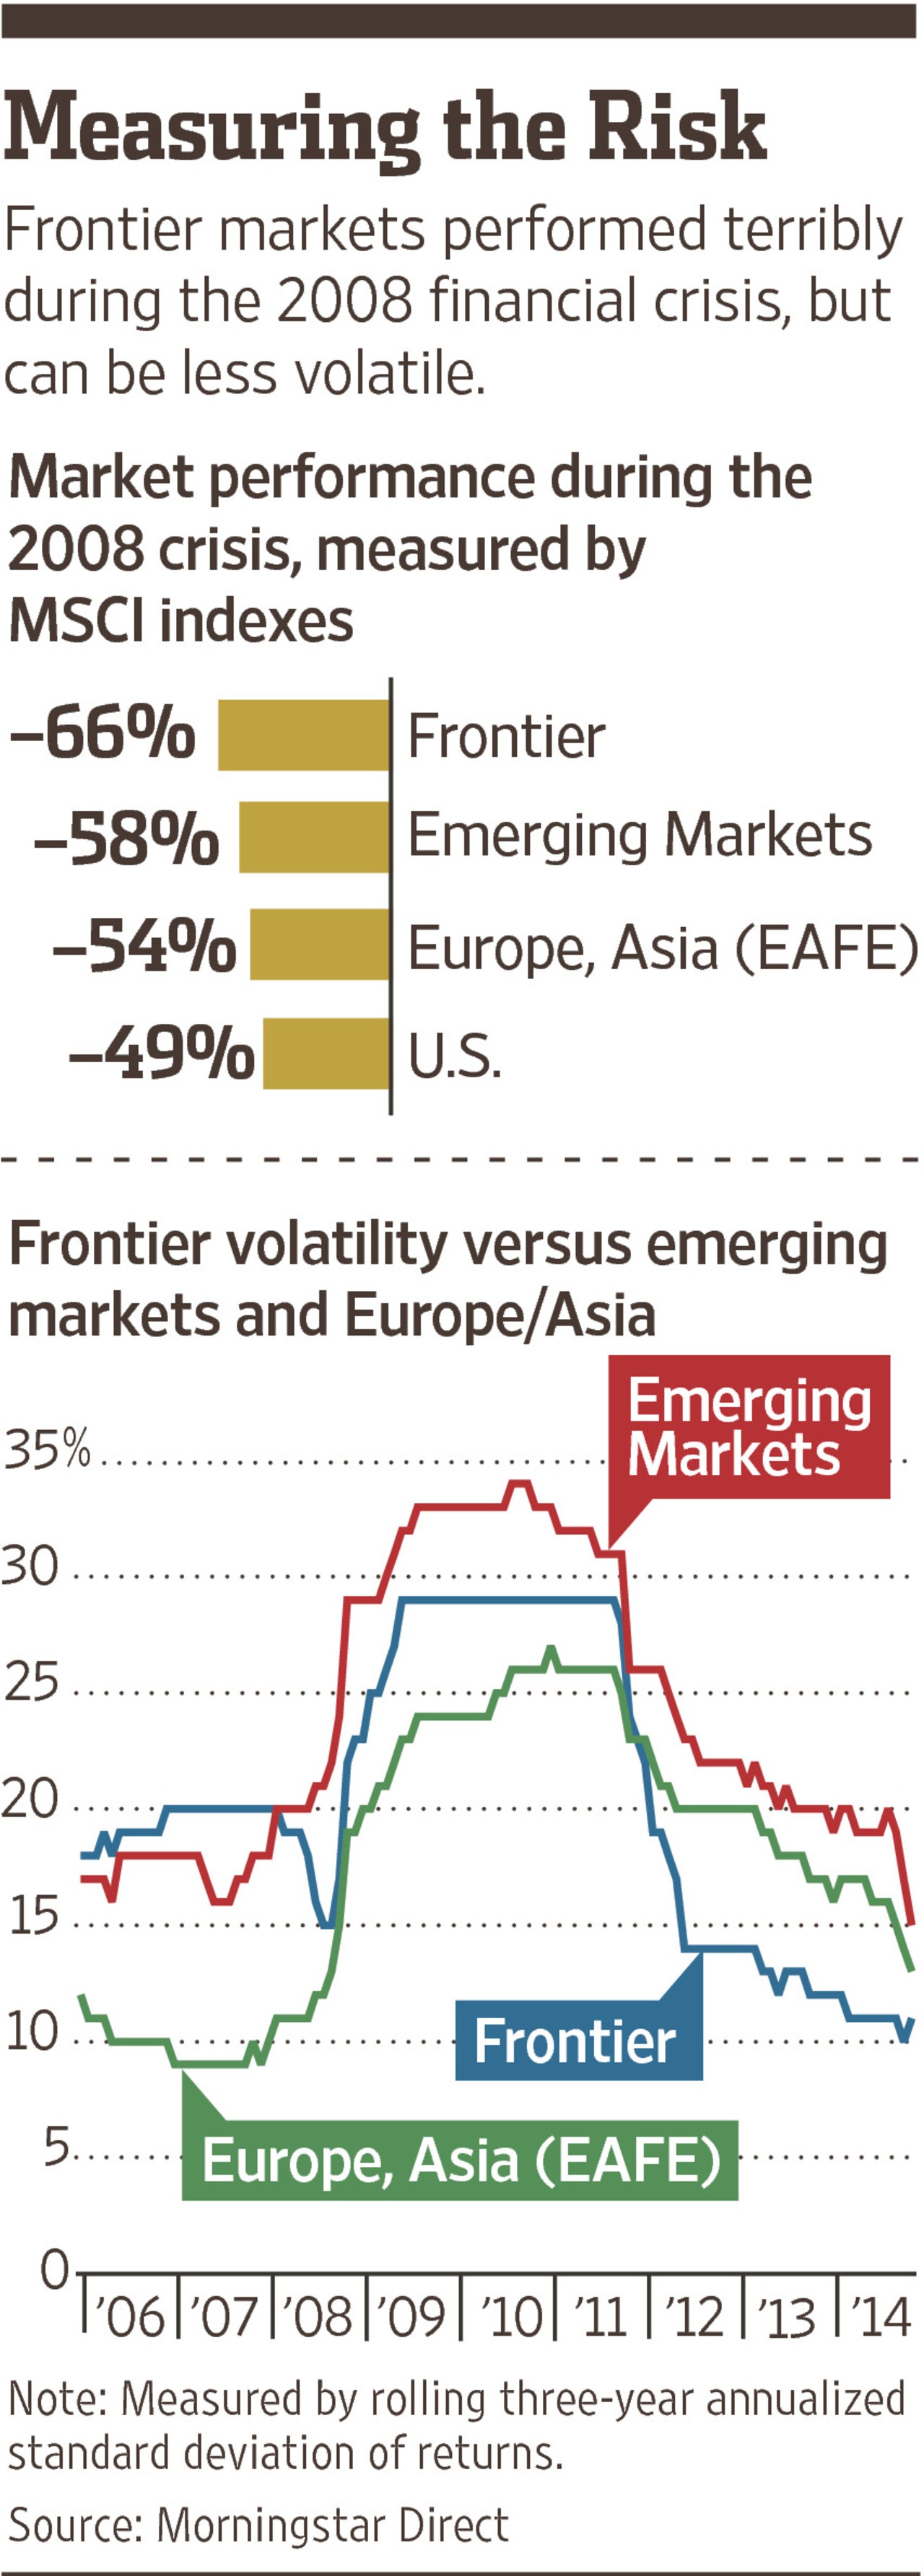
Source: A ‘Frontier’ Markets Survival Guide, Feb 8, 2015, The WSJ
Disclosure: No Positions
Update:
Size of Frontier Markets
Source: Frontier Markets: Concentrated And Misunderstood, Feb 3, 2015, Financial Advisor