Equity markets worldwide have stabilized in the past few weeks.Before that markets went on a roller-coaster ride due to a multitude of worries including the great Chinese slowdown, crash in commodity markets, the Federal Reserve interest rate hike, emerging markets’ currency crashes, plunge in oil prices, etc. However all of these issues should not be a great concern to long-term investors. Before the recent volatility, markets were hurt by the multi-year Greek crisis and possible disintegration of the EU. Markets eventually recovered from those scares only to be hit with the communist China’s stock market collapse and its impacts. Issues like oil price declines are not a major concern because fundamentally oil is a highly volatile commodity. The price of oil went from around $50 a barrel few years ago to over $140 and then gave up all the again only to tread higher and then fall again. Though oil is the most traded commodity in the world, it is the most volatile commodity also compared to copper, aluminum, iron ore, wheat, cola, etc. The key point is that oil prices going up and down is not a surprise and that alone should not cause a major decline in equity prices.
Long-term investors should ignore all these noises and use sharp market pullbacks to add high-quality stocks to their portfolios. The recent market dip due to China provided an excellent opportunity for such investors. From an article at Fidelity Investments:
To the surprise of some, global markets were rattled in 2015’s late-summer heat. The MSCI All-Country World Index fell 6% in Augustas a variety of factors unsettled investors. But remember, while market dips can trigger emotions of fear and concern—particularly if they occur suddenly and over a very short period of time—they are not uncommon (see the chart below). The U.S. stock market, which is just 7% from the all-time high set earlier this year, has a proven track record of recovering from market dips over a long enough period of time.
Click to enlarge
One key to successfully navigating turbulent markets is understanding what kind of investor you are, having a plan, and sticking to it.
“During this period of market volatility, we’ve seen three basic types of investors—the scared, the confident, and the insightful,” says John Sweeney, EVP of retirement and investing strategies. “The confident are generally those with a plan. The scared seem to be those without one. And the insightful are those, like most of our fund managers, who see pullbacks as an opportunity to potentially upgrade their holdings at lower prices.”
If you are scared, take a breath and think about formulating a plan to weather market volatility. Once you are confident in your plan, here are a few things to keep in mind when considering buying the dips.
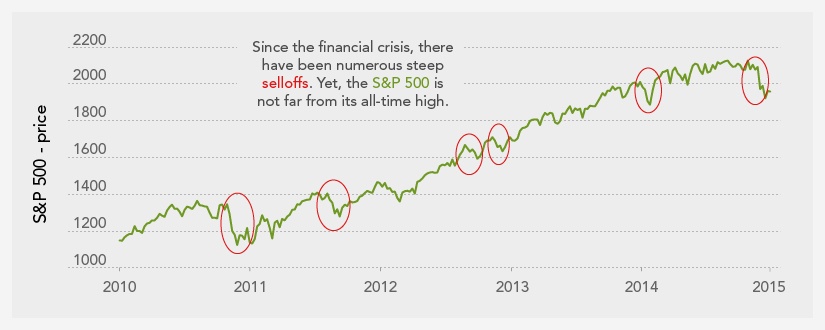
Source: Buying the market pullbacks, Fidelity Investments
Stocks in general are volatile than other asset classes. However they can provide better returns for investors willing to ignore the short-term volatility. Even blue-chip stocks can be volatile as shown in the chart below:
However, when the market takes a tumble, these retirees often find their retirement plans are far more exposed than they realized. That’s because, even though dividend-paying stocks may seem more stable, they’re still stocks, not bonds. While they may offer higher potential returns, that potential has a cost. Even a diverse portfolio of stocks, represented by the S&P 500®Dividends Aristocrats Index in the chart below, has been far more volatile than bonds.
Stocks—even blue-chip dividend payers—are more volatile than bonds
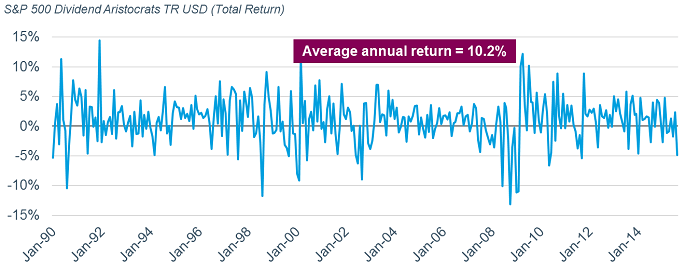
Source: Help Keep Volatility From Derailing Your Retirement Plan, Charles Schwab
In summary, it is wise for investors to take advantage of sharp market declines and avoid all the noises.
Five high-quality European stocks to consider for the long-term are listed below:
1.Company: BASF SE (BASFY)
Current Dividend Yield: 3.85%
Sector:Chemicals
Country: Germany
2.Company: Akzo Nobel (AKZOY)
Current Dividend Yield: 2.42%
Sector:Chemicals
Country: Holland
3.Company: Nestle SA (NSRGY)
Current Dividend Yield: 2.94%
Sector: Food Products
Country: Switzerland
4.Company: Continental AG (CTTAY)
Current Dividend Yield: 1.58%
Sector:Auto Components
Country: Germany
5.Company: Swedbank AB (SWDBY)
Current Dividend Yield: 5.57%
Sector: Banking
Country: Sweden
Note: Dividend yields noted above are as of Oct 16, 2015. Data is known to be accurate from sources used.Please use your own due diligence before making any investment decisions.
Disclosure: Long SWDBY