- Roth IRA Conversion: Does it Make Sense? (Charles Schwab)
- Lifestyle: Bhutanese getting more sleep, lifting happiness index (Asia Times) Meanwhile back in the good old USA Stressed, Tired, Rushed: A Portrait of the Modern Family (NY Times) and The most sleep-deprived states in the U.S. (MarketWatch
- Do Americans dream of longer holidays? (BBC)…..Keep Dreaming
- Apple spins impressive narrative of success, but are there holes in the story? (The Guardian)
- China’s car market: triple shock ahead (FT beyondbrics)
- The House View: The Challenge of Diversification (Forward Thinking)
- E-government generation (OECD Observer)
- Obituary: Keystone XL, age 7, choked on political baloney (Financial Post)
- Poland: Still going strong (ING)
- 13 TOP UK STOCKS FOR DIVIDEND GROWTH (Money Observer)

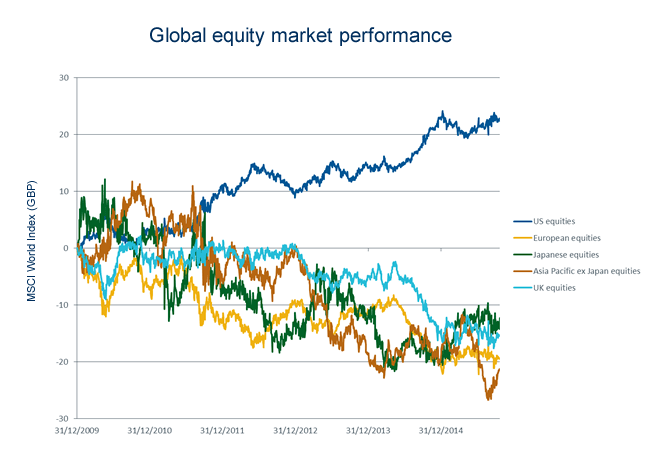
Should Investors Simply Stick With U.S. Stocks?
The S&P 500 is up by 2.11% year-to-date. Compared to this low return, many European indices have double digit returns so far this year.For example, the STOXX 600 is up by 11% and the CAC 40 has increased by nearly 16%.
However over the past few years US equities have greatly outperformed European and other global equities as shown in the chart below:
Click to enlarge
Note: The chart is based on MSCI Index returns in British Pound terms
Source: US equities: the best house on a bad street, Money Observer
The US equity market has performed extremely well due to many reasons including: the strength of the dollar, strong earnings, economics stability at home, stock buybacks, etc.
The rally in US stocks may not continue in the future. Even if US stocks do not outperform, European stocks especially have plenty of favorable factors to beat US equities. Some of the reasons to consider adding foreign developed equities to a diversified portfolio are:
- Since European and other developed stocks have lagged US stocks they are more likely to play catch up and hence have room to grow. Moreover the best time to buy stocks is when they are cheap and valuations are low.
- Dividend yields are generally higher overseas relative to the low 2% yield for the S&P 500.
- Certain sectors of the US market such as utilities and transportation are lagging this year.This does not bode well.
- Ultra-low interest rates have helped US firms engage in buyback binges of their own stocks and take on huge debt loads as well. When interest rates rise this party may not continue.
A Look At The Year-to-Date Returns Of Exchange-listed Latin American ADRs
The following table shows the year-to-date returns of Latin American ADRs listed on the US exchanges:
| S.No. | Company | Ticker | Stock Price as of Nov 2, 2015 | Year-T0-Date Change (%) | Industry | Country |
|---|---|---|---|---|---|---|
| 1 | Pampa Energia | PAM | $24.44 | 143.91% | Electricity | Argentina |
| 2 | Controladora Vuela Compania de Aviacion S.A.B. de C.V. - Volaris | VLRS | $17.30 | 91.80% | Travel & Leisure | México |
| 3 | Edenor | EDN | $17.66 | 88.47% | Electricity | Argentina |
| 4 | IRSA PROPIEDADES COMERCIALES S A | IRCP | $38.70 | 80.00% | Real Estate Inv&Serv | Argentina |
| 5 | Transportadora de Gas del Sur | TGS | $6.17 | 76.29% | Oil & Gas Producers | Argentina |
| 6 | BBVA Banco Frances | BFR | $22.84 | 65.63% | Banks | Argentina |
| 7 | Grupo Financiero Galicia | GGAL | $25.93 | 63.18% | Banks | Argentina |
| 8 | GRUMA - B Shares | GMK | $60.00 | 44.16% | Food Producers | México |
| 9 | Grupo Aeroportuario del Pacifico | PAC | $90.52 | 43.23% | IndustrialTransport. | México |
| 10 | Banco Macro | BMA | $60.88 | 39.22% | Banks | Argentina |
| 11 | Embotelladora Andina - B Shares | AKO.B | $22.10 | 30.00% | Beverages | Chile |
| 12 | Compania Cervecerias Unidas | CCU | $23.85 | 28.57% | Beverages | Chile |
| 13 | Petrobras Argentina S.A. | PZE | $6.35 | 28.54% | Oil & Gas Producers | Argentina |
| 14 | Cresud | CRESY | $12.95 | 28.34% | Food Producers | Argentina |
| 15 | Grupo Aeroportuario del Sureste | ASR | $154.89 | 17.48% | IndustrialTransport. | México |
| 16 | IRSA Inversiones y Representaciones | IRS | $17.95 | 16.79% | Real Estate Inv&Serv | Argentina |
| 17 | Grupo Aeroportuario (OMA) | OMAB | $41.80 | 15.02% | IndustrialTransport. | México |
| 18 | Fibria Celulose | FBR | $13.78 | 13.60% | Forestry & Paper | Brazil |
| 19 | Fomento Economico Mexicano | FMX | $97.79 | 11.09% | Beverages | México |
| 20 | Industrias Bachoco | IBA | $54.99 | 10.24% | Food Producers | México |
| 21 | Telecom Argentina | TEO | $19.89 | 2.79% | Mobile Telecom. | Argentina |
| 22 | BrasilAgro | LND | $2.90 | -2.36% | Real Estate Inv&Serv | Brazil |
| 23 | Banco Santander Chile | BSAC | $19.15 | -2.89% | Banks | Chile |
| 24 | Nortel Invesora | NTL | $19.59 | -6.67% | Mobile Telecom. | Argentina |
| 25 | Banco de Chile | BCH | $63.70 | -7.60% | Banks | Chile |
| 26 | Ultrapar | UGP | $17.59 | -7.76% | Gas,H20&Multiutility | Brazil |
| 27 | Coca-Cola Femsa - L Shares | KOF | $77.73 | -10.16% | Beverages | México |
| 28 | Vina Concha y Toro | VCO | $33.45 | -11.44% | Beverages | Chile |
| 29 | Centrais Eletricas Brasileiras-Eletrobras | EBR.B | $2.53 | -11.85% | Electricity | Brazil |
| 30 | Braskem | BAK | $11.34 | -12.16% | Chemicals | Brazil |
| 31 | Santander Mexico | BSMX | $9.05 | -12.64% | Financial Services | México |
| 32 | Grupo Televisa | TV | $29.68 | -12.86% | Media | México |
| 33 | Cencosud | CNCO | $6.63 | -13.78% | Food &Drug Retailers | Chile |
| 34 | Gafisa | GFA | $1.31 | -14.94% | HouseGoods&HomeConst | Brazil |
| 35 | Tenaris | TS | $25.48 | -15.66% | Indust.Metals&Mining | Argentina |
| 36 | Endesa-Empresa Nacional de Electricidad | EOC | $37.66 | -15.82% | Electricity | Chile |
| 37 | Grupo Simec - B Shares | SIM | $8.31 | -15.89% | Indust.Metals&Mining | México |
| 38 | Ternium | TX | $14.68 | -16.78% | Indust.Metals&Mining | Argentina |
| 39 | Soc. Quimica y Minera de Chile | SQM | $19.57 | -18.05% | Chemicals | Chile |
| 40 | Enersis | ENI | $13.12 | -18.15% | Electricity | Chile |
| 41 | YPF | YPF | $21.60 | -18.40% | Oil & Gas Producers | Argentina |
| 42 | Embraer | ERJ | $29.90 | -18.88% | Aerospace & Defense | Brazil |
| 43 | America Movil | AMX | $17.76 | -19.93% | Mobile Telecom. | México |
| 44 | AMBEV S.A | ABEV | $4.95 | -20.42% | Beverages | Brazil |
| 45 | America Movil - Series A | AMOV | $17.50 | -20.89% | Mobile Telecom. | México |
| 46 | Grupo Aval Acciones y Valores S.A. | AVAL | $8.12 | -21.85% | Financial Services | Colombia |
| 47 | Cementos Pacasmayo SAA | CPAC | $6.78 | -22.34% | Construct.&Materials | Peru |
| 48 | Corpbanca | BCA | $13.51 | -24.02% | Banks | Chile |
| 49 | Banco Santander Brasil | BSBR | $3.61 | -28.09% | Banks | Brazil |
| 50 | Bancolombia - Pref | CIB | $34.15 | -28.68% | Banks | Colombia |
| 51 | SABESP | SBS | $4.44 | -29.41% | Gas,H20&Multiutility | Brazil |
| 52 | Petroleo Brasileiro-Petrobras | PBR | $5.02 | -31.23% | Oil & Gas Producers | Brazil |
| 53 | BRF S.A. | BRFS | $15.34 | -34.30% | Food Producers | Brazil |
| 54 | Compania de Minas Buenaventura | BVN | $6.28 | -34.31% | Mining | Peru |
| 55 | Cemex | CX | $6.36 | -35.10% | Construct.&Materials | México |
| 56 | Comp. Paranaense de Energia-COPEL | ELP | $8.48 | -35.61% | Electricity | Brazil |
| 57 | CPFL Energia | CPL | $8.10 | -38.40% | Electricity | Brazil |
| 58 | Centrais Eletricas Brasileiras-Eletrobras | EBR | $1.30 | -39.25% | Electricity | Brazil |
| 59 | Companhia Siderurgica Nacional-CSN | SID | $1.25 | -39.90% | Indust.Metals&Mining | Brazil |
| 60 | Itau Unibanco | ITUB | $7.10 | -39.98% | Banks | Brazil |
| 61 | Telefonica Brasil | VIV | $10.46 | -40.84% | Fixed Line Telecom. | Brazil |
| 62 | Banco Bradesco | BBDO | $6.31 | -41.41% | Banks | Brazil |
| 63 | Ecopetrol | EC | $9.70 | -43.34% | Oil & Gas Producers | Colombia |
| 64 | Vale | VALE | $4.53 | -44.62% | Indust.Metals&Mining | Brazil |
| 65 | Banco Bradesco | BBD | $5.53 | -50.36% | Banks | Brazil |
| 66 | TIM Participacoes | TSU | $10.86 | -51.10% | Mobile Telecom. | Brazil |
| 67 | Latam Airlines Group | LFL | $5.64 | -52.92% | Travel & Leisure | Chile |
| 68 | Gerdau | GGB | $1.45 | -59.15% | Indust.Metals&Mining | Brazil |
| 69 | Companhia Energetica de Minas Gerais-CEMIG | CIG | $1.94 | -60.97% | Electricity | Brazil |
| 70 | Companhia Brasileira de Distribuicao-CBD | CBD | $13.64 | -62.96% | Food &Drug Retailers | Brazil |
| 71 | Avianca Holdings S.A. | AVH | $4.18 | -64.36% | Travel & Leisure | Colombia |
| 72 | Companhia Energetica de Minas Gerais-CEMIG | CIG | $1.76 | -67.10% | Electricity | Brazil |
| 73 | Grana y Montero S.A.A. | GRAM | $3.96 | -68.67% | Construct.&Materials | Peru |
| 74 | ICA | ICA | $1.53 | -68.90% | Construct.&Materials | México |
| 75 | Oi | OIBR | $0.85 | -74.63% | Fixed Line Telecom. | Brazil |
| 76 | Gol | GOL | $0.88 | -84.70% | Travel & Leisure | Brazil |
Source: BNY Mellon
A few observations:
- Pampa Energia(PAM) of Argentina has shot up by nearly 144% so far this year. All Argentina ADRs are on fire this year due to the most likely change in the country’s leadership.
- Among the Latin American airlines, Mexico-based Volaris(VLRS) has performed very well.
- Bancolombia(CIB) has recovered strongly from the lows reached during the September selloff but is still off about 29% year-to-date. The bank is an excellent way to gain exposure to Colombia.
- Brazilian stocks are some of the worst performers. Former high-fliers such as Petrobras and SABESP are trading in the low single digits.
Disclosure: Long BCH,BSAC,BCA,PBR,ITUB,BBD
How To Profit From The Ongoing European Economic Recovery?
One of the ways to profit from the ongoing European economic recovery is to invest directly in companies that operate in the continent. A recently started interesting ETF provides an option to gain exposure to such companies via an ETF. The WisdomTree Europe Local Recovery Fund (EZR) seeks to profit from the continent’s recovery.
The fund’s description from the provider website:
WisdomTree Europe Local Recovery Fund seeks to track investment results of European companies that are sensitive to economic growth prospects in the eurozone and that derive more than 50% of their revenue from Europe. The Fund seeks to maximize exposure to European companies that may benefit from Europe’s economic recovery and Europeans’ increased buying power.
The fund has just $2.4 million in assets and the expense ratio is 0.48%. It would be interesting to see how this ETF performs in the next few months.
The fund holds stocks in 210 firms. The top ten are listed below:
- Total SA (TOT)
- BASF SE (BASFY)
- Allianz SE (AZSEY)
- BNP Paribas (BNPQY)
- Axa SA (AXAHY)
- Vinci SA (VCISY)
- Intesa Sanpaolo SpA (ISNPY)
- Inditex SA
- Societe Generale (SCGLY)
- ENI SpA (E)
Vinci is a great construction and infrastructure maintenance play. But the stock seems to never move higher beyond a range. Hence from an investment point of view this company can be avoided, if one were to invest directly in the firms included in this ETF. French banks BNP Paribas and SocGen haven’t still re-gained their levels reached before the global financial crisis.
In general, the ETF holdings are excellent firms that stand to benefit from the growing European rebound.
The complete list of the 210 stocks in the ETF can be downloaded in Excel here.
Disclosure; Long AXAHY and SCGLY
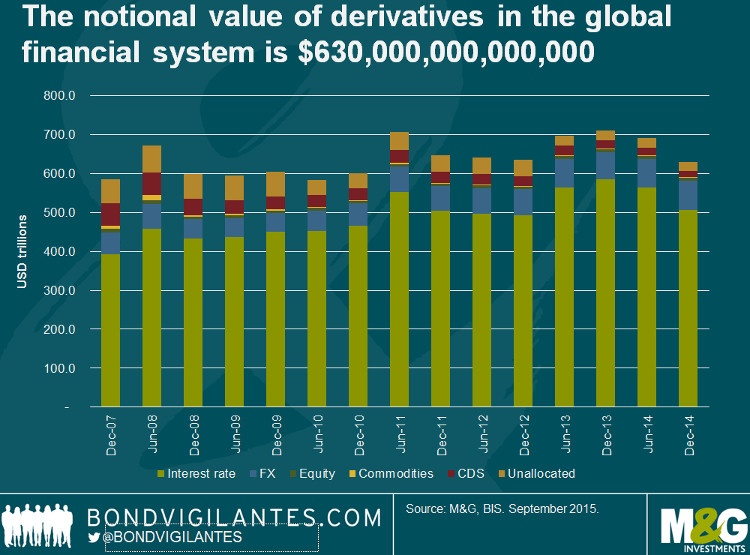
Global Derivatives Exposure = $630,000,000,000,000
Halloween for 2015 is over. Investors may have been scared by the ghouls, spooky goblins, ghosts and haunted houses. However the real scary part for investors may come sometime in the future. One of the causes of the Global Financial Crisis(GFC) of 2008-09 was derivatives. These scary financial instruments are like hand-held grenades. Careless handling will lead to catastrophic results.
According to one estimate, the notional value of derivative exposure in the global financial system is a mind-boggling $630.0 Trillion.
Click to enlarge
From an article in Money Observer:
The notional value of derivatives in the global financial system is around $630 trillion (£410.9 trillion). To put this in comparison, the value of global GDP is $77.3 trillion.
Whilst $630 trillion is a huge number, it does overstate the dangers lurking in the global derivatives market. The notional amount does not reflect the assets at risk in a derivatives contract trade.
According to the BIS, the gross market value of the global OTC derivatives market is $20.9 trillion (close to a third of global GDP).
Source: Five scary charts Freddy Krueger would be proud of, Money Observer