European banks have under-performed their U.S. peers for many years now. Though the Global Financial Crisis ended many years ago, European banks are still stuck in mud. After the financial crisis, banks in the continent muddled through the sovereign debt crises including the multiple episodes of the Greek saga. Last year it appeared like they finally stabilized and were finally catching the escape velocity to head into the orbit. But that rosy scenario failed to materialize and now they are staring down again at the bottom of the abyss.
With just one month over, European banking stocks are already down heavily so far this year. The benchmark STOXX® Europe 600 Banks Index is down a shocking 25% as shown in the chart below:
Click to enlarge
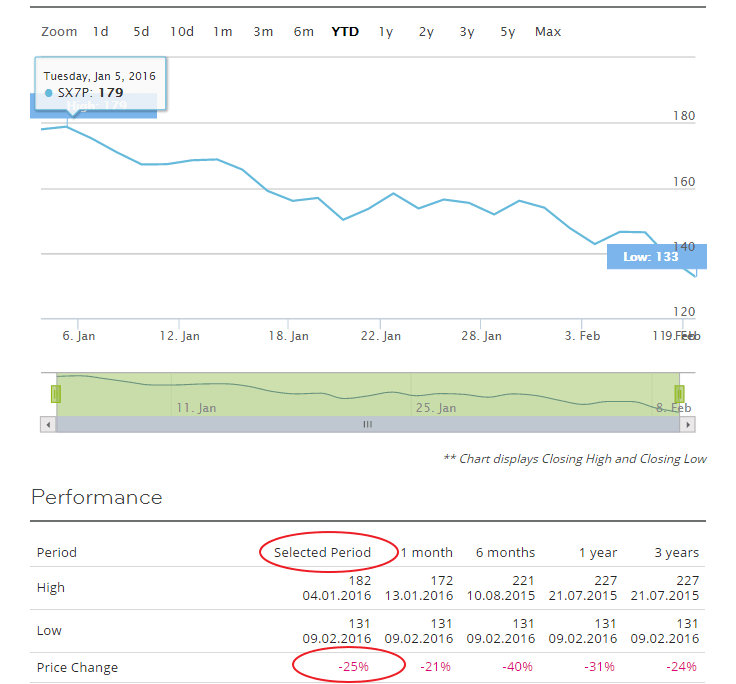
Source: STOXX
According to John Stepek of MoneyWeek European banks are not very good in making money. I agree with this assessment. John further wrote:
The trouble with the banking sector
You see, European banks have been in trouble for a long time, and the process of cleaning up their balance sheets is far less advanced than in the US or even the UK, as James Ferguson of MacroStrategy Partnership regularly points out.
None of this is particularly new. As The Wall Street Journal puts it: “Banks don’t face an acute crisis as in 2008. It is something that in some ways looks worse: a chronic profitability crisis that makes it impossible for banks to build up barely-adequate capital bases.”
So your basic problem here is that the banks still need to do a lot of restructuring work. But if they are doing it against a backdrop of minuscule rate spreads and a potential recession – well, that’s going to take its toll.
And if they can’t keep topping up their capital via profits, then they might end up needing to stop paying dividends, or coupons on junior debt, or they might need to issue equity. Or, as the Wall Street Journal notes, they might have to “make riskier loans that pay more but have a higher chance of default”.
Hence the fear. Sure, it’s hard to see a bank going bust in a world where central banks have already made it clear that they will keep banks liquid. Whether you’ll make any money by investing in the things is quite another matter. And the last thing the world needs is the monetary transmission mechanism being gummed up again into the bargain.
Source: The biggest problem for banks: they aren’t very good at making money by John Stepek, MoneyWeek, Feb 9, 2016
Here are a few comments on European banks:
- In addition to not being good at making money, most European banks are run by incompetent leaders and boards. For example, banks were very reluctant to raise capital by issuing new shares after the financial crisis.
- Unlike the U.S., regulatory and policy makers in Europe dither over every single issue. So on top of inept management investors are forced to deal with moronic policymakers and regulators who move at the speed at sloths. For example, the UK is a classic example of this case. The British government, which usually acts like its a nanny, still owns stakes in Royal Bank of Scotland(RBS), years after bailout out the failed bank. Ironically the bank’s name still includes the word “Royal”.
- Banks were slow to slash costs compared to their US peers. Keeping open thousands of unprofitable branches to thousands of excess employees make the banks perennially inefficient and noncompetitive. UK-based Barclays(BCS) is one such example.
From an investment standpoint, select European lenders are worth looking at current levels. My classification of these banks:
The Good: ING Groep NV (ING), Nordea Bank AB (NRBAY), Swedbank AB (SWDBY), Danske Bank (DNKEY), Svenska Handelsbanken AB (SVNLY), UBS AG (UBS)
The Bad: Banco Santander SA (SAN), Banco Bilbao Vizcaya Argentaria S.A (BBVA) , Erste Group Bank AG (EBKDY)
The Ugly: Deutsche Bank AG (DB), Commerzbank AG (CRZBY), The Royal Bank of Scotland Group plc (RBS), Barclays PLC (BCS), Societe Generale (SCGLY), Lloyds Banking Group PLC (LYG)
Disclosure: Long SAN, BBVA, ING, EBKDY, SWDBY, SCGLY