The Chinese equity market is characterized by booms and busts. Since 1996, the upward and downward movements in the market has been violent. For example, during the Global Financial Crisis of 2008-09 the MSCI China Index lost 65% of its value. From 2004 thru the peak in 2008, the index soared by an astonishing 757%.
Click to enlarge
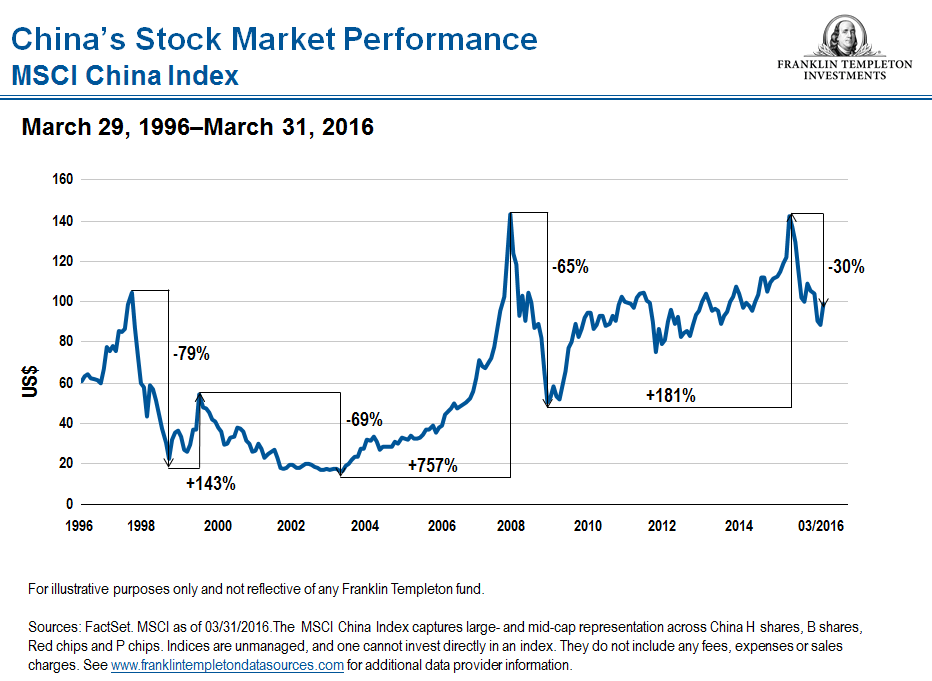
Source: We Still Don’t See a China Hard Landing, Mark Mobius, Franklin Templeton Investments, May 9, 2016
A few facts on the China stock market from the above Mobius article:
China’s A-share market is large, with more than 2,000 companies listed on the Shanghai Stock Exchange and about 1,000 listed on the Shenzhen and other stock exchanges in China. Quoted in local currency, only residents of the People’s Republic of China (PRC) or those under the Qualified Foreign Institutional Investor (QFII) and Renminbi Qualified Foreign Institutional Investor (RQFII) schemes can trade A-shares, which are considered the “domestic” market. The main characteristic of the domestic market is that it’s dominated by retail investors, so there are often big swings that tend to be tied to short-term investor sentiment rather than longer-term fundamentals. Index provider MSCI has been considering the inclusion of the Shanghai domestic market in its benchmark indexes, and it has even been talking about including 5% of China A-shares’ free float-adjusted market capitalization in the MSCI Emerging Markets Index. MSCI is expected to announce its decision in June 2016, and if A-shares are included, we would anticipate increased foreign investor interest in China’s domestic market.
The MSCI China Index captures large- and mid-cap representation across China H-shares (securities of Chinese companies traded in Hong Kong and quoted in Hong Kong dollars), B-shares (securities of Chinese companies that trade on either the Shanghai or Shenzhen stock exchanges and quoted in US or Hong Kong dollars), Red chips (companies outside the PRC traded in Hong Kong, but owned directly or indirectly by mainland Chinese state-entities) and P chips (companies outside the PRC traded in Hong Kong and owned by individuals in mainland China).
Here are a few points to remember before investing in China:
- Just like other emerging markets Chinese equities will always be volatile.
- As China follows a cross between democracy and communism, it will always be more unpredictable in terms of market interventions by the state, As a result, extreme booms followed by busts are to be expected.
- As retail investor participation is high in the domestic market, any sign of volatility or bear market leads to panicked investors running for the exit. On the other hand, soaring stocks lead more mom-and-pop investors bid up share prices to the stratosphere.
- While much of the growth in the past came from infrastructure investments, currently the state is trying to change the economy to a consumption-based economy. This process will take many years and there is no guarantee of success. As a result, infrastructure-based firms are not going to see their stocks sky-rocket any time soon.