P/E Ratio is Not a Predictor of Future Equity Returns

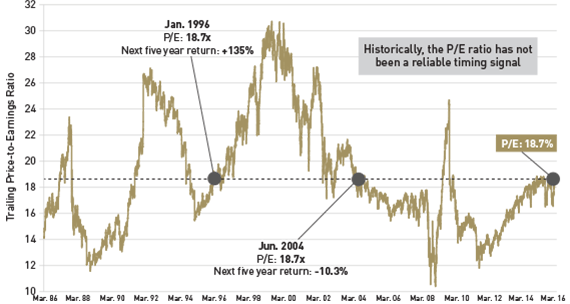
The Price/Earnings ratio (P/E) is sometimes used by investors to identify if equities are cheap or expensive and if getting in when the ratio is lower means higher returns in the future. However an article by Lord Abbett notes that P/E ratio alone is not a good indicator of future market returns.

From the article:

History shows, however, that, in the short run, the P/E ratio has not been a reliable predictor of future market returns. In the past 20 years, for example, the S&P 500 has traded at its current level of approximately 18.7 times trailing earnings twice—once in January 1996 and again in June 2004. What happened over the next five years in each case? The results were very different. Cumulative returns five years out from 1996 reached triple digits; after 2004, returns were negative (see Chart 1).

PE Ratio Unreliable market signal


If P/Es haven’t been reliable predictors of short-term market returns, what about other commonly cited metrics? We’ve looked at a number of them—including the Shiller CAPE ratio, EPS growth, earnings growth, dividend yield, the U.S. Federal Reserve (Fed) model, and U.S. gross domestic product—to assess how well they predict the next 12 months of stock returns. The answer: Not well at all.

Moreover, over the long term, market timing takes a toll on equity fund returns. As a previous blog reported, a Morningstar study in 2014 depicted significant shortfalls over a 10-year period across seven major fund categories caused by poor market timing.

If popular metrics tell us very little about the near-term direction of the stock market, then that should speak to the difficulty of market timing.
Source: Stocks: Put Time on Your Side, Lord Abbett

So the key takeaway for investors is that the P/E ratio alone should not be the deciding factor when making investment decisions. Rather the ratio must be used together with other factors and invest for the long-term.

Knowledge is Power: Fascism, 401K Monster, DAX Index Edition

Leipzig-Halle Airport-3

Leipzig Halle Airport, Germany

Dividend Payout Ratio of U.S. vs European Stocks

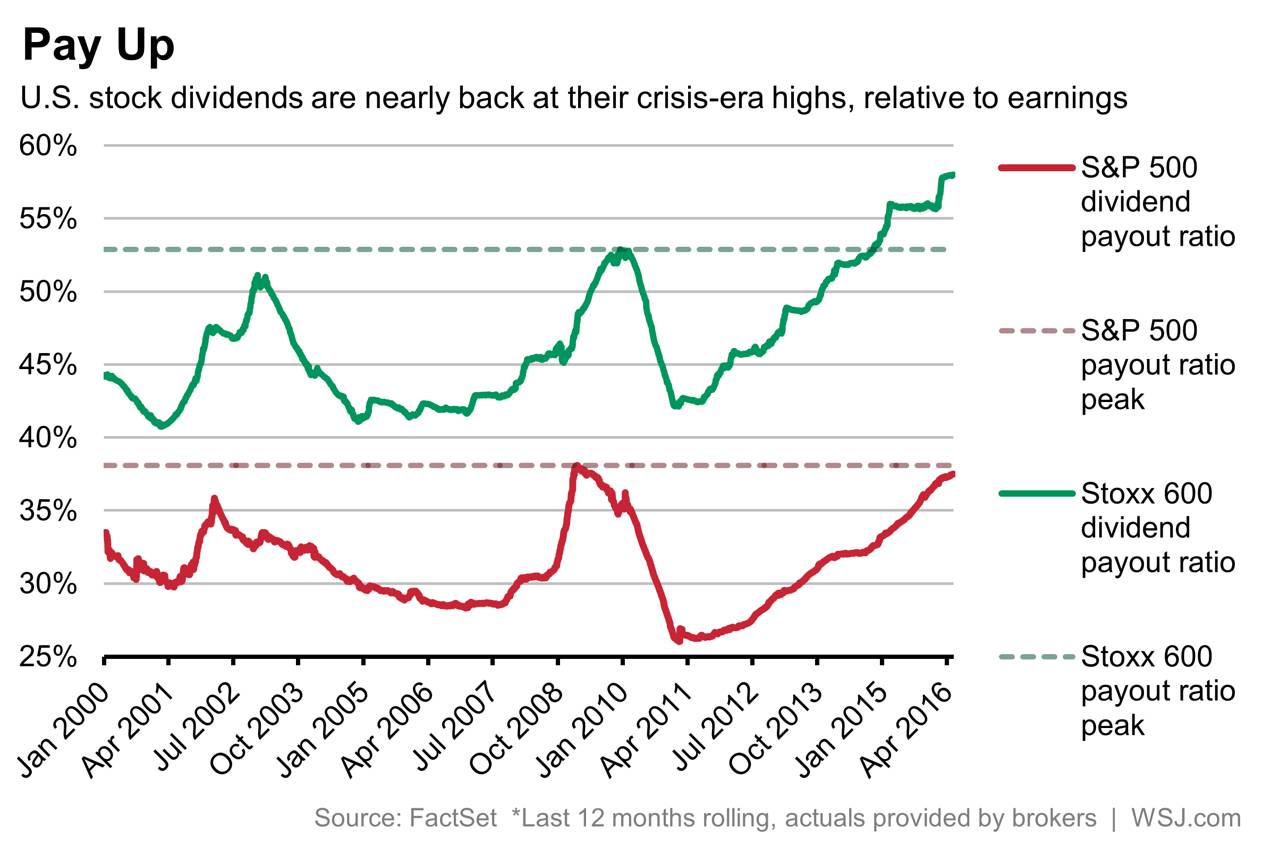
U.S. firms are paying out more of their earnings in dividends to shareholders than investing in R&D or growing their businesses according to a report in the journal today. Though the dividend yield of the S&P 500 has stayed around 2% for many years, the payout ratio has increased in recent years to record levels.

The following chart shows the dividend payout ratio of S&P 500 against European stocks as measured by the Stoxx 600 index:

Click to enlarge

US vs European Dividend Payout Ratio

From the news report:

S&P 500 companies have paid out 37.5% of their earnings in dividends over the past 12 months, just a fraction below the 38.1% recorded in 2009, when earnings were plunging during the depths of the financial crisis.

In Europe, the payout ratio surpassed financial crisis levels in late 2014. The Stoxx 600′s payout ratio is now at 58%. Part of the difference between the U.S. and European ratios is down to a preference for share buybacks in the U.S.

Source: Fund Managers Sour on Dividend Boom as U.S. Payouts Climb Towards New Record, WSJ, May 18, 2016

Many U.S. firms generally prefer to buy back their own shares than pay out cash in the form of dividends to shareholders. European companies prefer to payout dividends than share buybacks.

Also checkout:

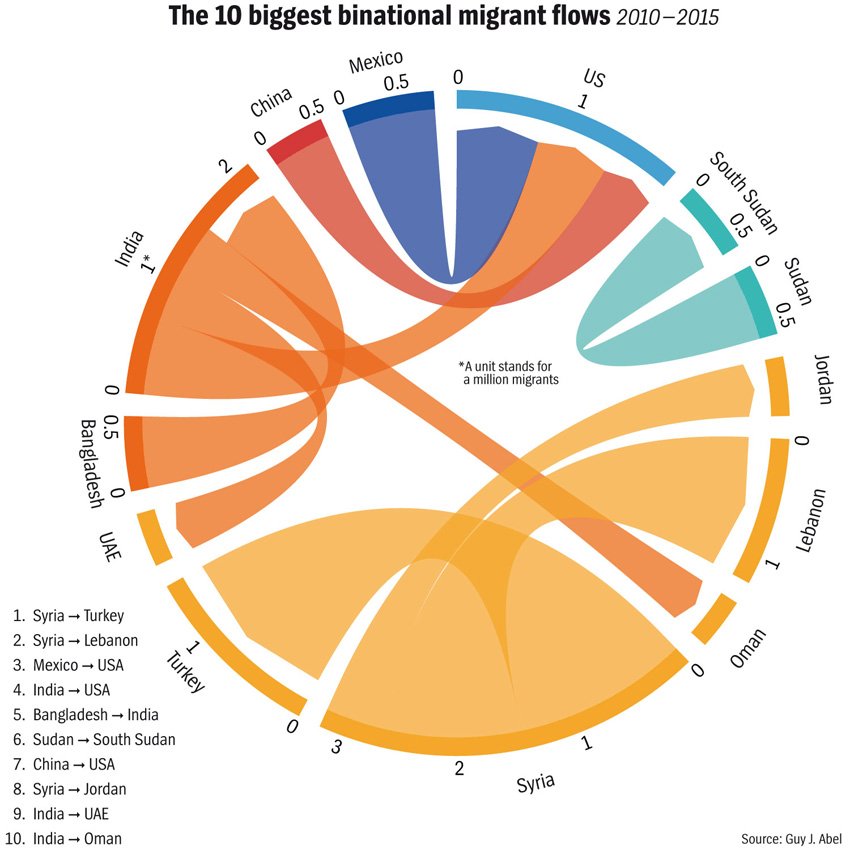
The 10 Biggest Binational Migrant Flows 2010-2015

Migration is a major issue globally. In the past few years the mass migration of people from the Middle East and Africa into Europe has become a major headline news for the media and politicians alike.

Sometimes migration from one specific country to another tend to be very high for a variety of reasons. For instance it could be due to the reason that the two countries are neighbors such as Mexico and the US and the strong economic, political, cultural links between them.

The following neat graphic shows the 10  biggest binational migration flows during 2010-2015:

Click to enlarge

Top 10 binational migrant flows 2010-2015

Source: Global Migration? Actually, The World Is Staying Home, Der Speigel

The three top source countries for migrants into the US are Mexico, India and China.

31 Foreign Stocks With Large Market Capitalization on the NYSE

The following foreign companies resulted from a stock screen for firms with > $50.0 billion market cap on the NYSE::

NameSymbolMarket CapitalizationIndustryDividend Yield
 China Mobile Ltd. (ADR)CHL $227.7B Wireless Telecommunication Services 4.76%
 Alibaba Group Holding LtdBABA $200.5B Internet & Catalog Retail --
 Anheuser Busch Inbev SA (ADR)BUD $203.3B Beverages 3.17%
 Novartis AG (ADR)NVS $197.2B Pharmaceuticals 3.59%
 Toyota Motor Corp (ADR)TM $172.1B Automobiles 3.61%
 HSBC Holdings plc (ADR)HSBC $123.3B Banks 9.78%
 Taiwan Semiconductor Mfg. Co. Ltd. (ADR)TSM $117.2B Semiconductors & Semiconductor Equipment 3.13%
 Total SA (ADR)TOT $120.8B Oil, Gas & Consumable Fuels 5.55%
 Royal Dutch Shell plc (ADR)RDS.A $201.6B Oil, Gas & Consumable Fuels 7.37%
 Novo Nordisk A/S (ADR)NVO $110.2B Pharmaceuticals 1.75%
 Sanofi SA (ADR)SNY $103.4B Pharmaceuticals 4.11%
 GlaxoSmithKline plc (ADR)GSK $103.8B Pharmaceuticals 5.52%
 BP plc (ADR)BP $97.3B Oil, Gas & Consumable Fuels 7.49%
 Nippon Telegraph & Telephone Corp (ADR)NTT $99.2B Diversified Telecommunication Services 1.67%
 NTT Docomo Inc (ADR)DCM $102.4B Wireless Telecommunication Services 2.21%
 SAP SE (ADR)SAP $95.7B Software 1.57%
 Westpac Banking Corp (ADR)WBK $76.9B Banks 6.34%
 AstraZeneca plc (ADR)AZN $71.8B Pharmaceuticals 4.86%
 Lloyds Banking Group PLC (ADR)LYG $67.7B Banks 3.31%
 Diageo plc (ADR)DEO $68.5B Beverages 3.12%
 Banco Santander, S.A. (ADR)SAN $66.6B Banks 4.81%
 Mitsubishi UFJ Financial Group Inc (ADR)MTU $65.8B Banks 3.21%
 Unilever plc (ADR)UL $134.9B Food Products 3.61%
 Unilever N.V. (ADR)UN $134.9B Food Products 3.70%
 Eni SpA (ADR)E $55.5B Oil, Gas & Consumable Fuels 5.77%
 National Grid plc (ADR)NGG $54.0B Multi-Utilities 4.52%
 HDFC Bank Limited (ADR)HDB $43.3B Banks 0.58%
 CNOOC Ltd (ADR)CEO $51.7B Oil, Gas & Consumable Fuels 5.48%
 Statoil ASA(ADR)STO $52.4B Oil, Gas & Consumable Fuels 6.72%
 Teva Pharmaceutical Industries Ltd (ADR)TEVA $54.2B Pharmaceuticals 2.70%
 Telefonica S.A. (ADR)TEF $52.6B Diversified Telecommunication Services 7.24%

Due to the collapse in oil prices, oil firms do not lead with huge market caps. China-based mobile operate China Mobile has the largest market cap followed by alcoholic beverage maker  Anheuser Busch Inbev SA.