The Top 10 Foreign Holders of U.S. Debt

The current Total Public Debt Outstanding is over $19 Trillion or $19,428,079,384,183.27 to be more precise according to the Treasury Department, Out of this debt mountain, the debt held by the public is over $14 Trillion.

The total US debt held by foreign holders stood at $6,281 billion as of June, 2016 according to Treasury data. Foreign holders account for about 32.5% of the total outstanding US debt. China is the largest holder of US with holdings of over $1.2 Trillion followed by Japan.

The ten largest foreign holders of US debt are shown in the chart below:

Click to enlarge

Foreign Holders of US Debt

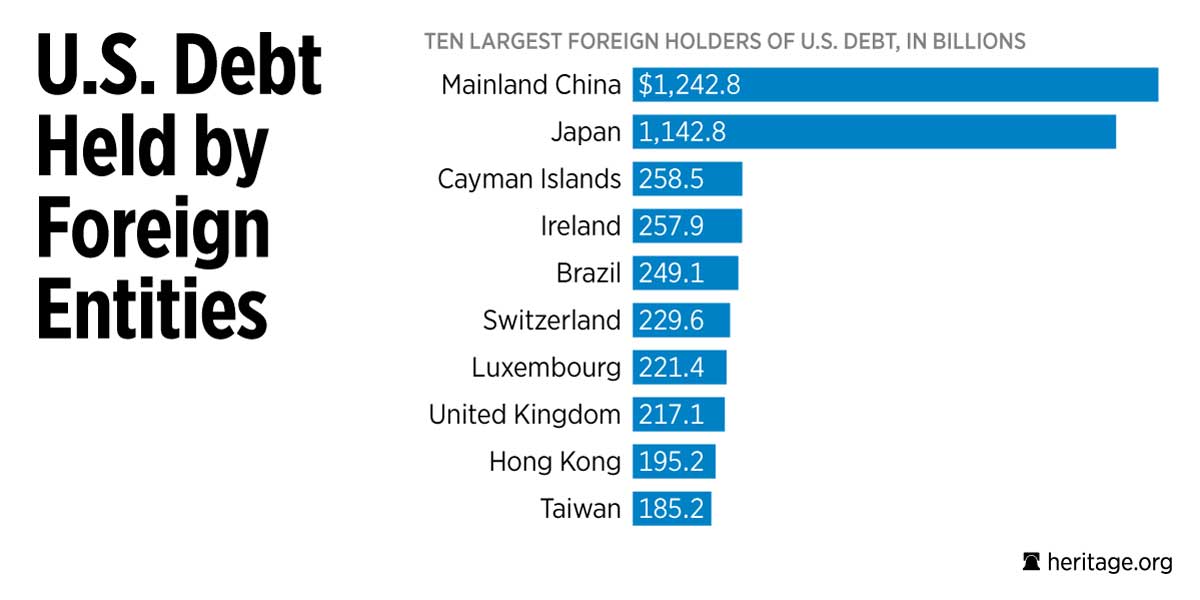
Note: Chart data as of April, 2016

Source: The Heritage Foundation

The British Overseas Territory of Cayman Islands in the Caribbean holds over $258 billion of US debt. The tiny island country with a population of less than 60,000 holds such high quantity of debt because it is basically a tax haven that is used by wealthy individuals and companies to legally avoid or reduce paying taxes. Thousands of institutions are registered in the country that use as a form of Post Office (PO) Box to channel funds into US debt from other countries.

Additional source:

Petrobras: Brazil’s Fallen Star

The stock price of Petrobras(PBR), Brazilian oil firm closed at $8.73 on Friday August 12th. The market cap stood at about $57 billion. This is a far cry from the peak market cap a few years ago when Petrobras was the rising superstar of the oil world and was considered the crown jewel of emerging Brazil. In 2008, the stock price reached over $70.

The decline in crude oil prices is one reason for the stock price plunge. However in Petrobras’ case the main reason for the collapse of the oil giant was corruption and fraud.

From Petrobras’ Olympic-sized oil woes: How the world was at Brazil’s feet, but kicked it away by Yadullah Hussain in the Financial Post on Aug 5, 2016:

Petrobras stock Price Chart


“Petrobras is a complicated beast,” says Eurasia’s Neves. “We have seen moments in the last 15 to 20 years where Petrobras was driven by market dynamics rather than political dynamics — more recently it was the other way around. Now we are seeing the pendulum swing again.”

Government creep in Petrobras saw the company’s market cap fizzle to US$52.2 billion today from $241 billion in 2007 as it become a pure policy tool, forced to keep prices down to control inflation.

Petrobas’ debt has ballooned five-fold over the past nine years, while net income of US$13.1 billion in 2007 shriveled to a US$1.1 billion loss in the first quarter of 2016. Analysts have cast doubt over the company’s US$130 billion investment plans during the next five years.

“Our business and strategic plans are being revised and the new plans will be announced (at) the beginning of October,” Estephani Zavarise, a Petrobras media executive, said in an emailed statement.

The whole article is worth a read.

The Star also ran a article on Brazil’s rise and fall recently. From that piece:

Three billion people worldwide were expected to watch Friday night’s opening ceremony at the Rio 2016 Summer Olympic Games. In addition, more than 80,000 Brazilians, visitors and athletes were there in person in Rio de Janeiro’s iconic Maracana Stadium.

But expected to be missing in action was the man who almost single-handedly won the Olympics for Brazil — former president Luiz Inacio Lula da Silva, once regarded as the saviour of his country.

Now facing potential corruption charges, he announced last week that he would boycott the opening ceremony. And so did his successor and ally, suspended president Dilma Rousseff.

Their announcement came as no surprise to most Brazilians. The euphoria of winning the 2016 Games seven years ago has long vanished.

For the most part, polls suggest that Brazilians are unhappy hosts. Beyond the athletic exuberance of these Olympic Games lies a battered and demoralized country.

Source: Lula’s rise and fall mirrors Brazil’s road to Olympics: Burman, The Star, Aug 6, 2016

A few takeaways from the Petrobras collapse for global investors:

  • Emerging markets are inherently riskier than developed markets and Brazil is no exception. So its important to allocate only a small percentage of one’s portfolio to emerging markets.
  • Seemingly wonderful and great company can also turn into Enron-style frauds. Hence putting all eggs in one basket is a fool’s game.
  • State-owned firms have different priorities than non-state owned firms. For example, Petrobras or other National Oil Companies such as Petronas of Malaysia may focus on employing thousands of employees and satisfying the demands of the state in every action the company takes. Private oil firms such as Exxon Mobil(XOM), Total(TOT), Chevron(CVX) , etc. are run for their shareholders and not the state. The US government cannot dictate where ExxonMobil should invest or how much dividends it should pay since the state does not own the company.

Disclosure: Long PBR

Contribution of Dividends to Total Return in S&P 500 1990-2015

The contribution of dividends to total returns is significant. In decades when stocks yielded negative returns the return from dividends offer a cushion to the overall portfolio returns.

The chart below shows the contribution of dividends to the total return of the S&P 500 by decade:

Click to enlarge

Dividend Contribution to Total Return S&P 500

Source: Dividends Matter, Rational Advisors

From the above research report:

Historical Perspective

Throughout the majority of the 20th century, income generation was the primary focus for most equity investors. With accounting standards and regulatory oversight a far cry from where it is today, a stock’s dividend was one of the few reliable measures by which investors could determine the health of public companies. While recent equity bull markets gave some credence to the notion that growth was perhaps superior to income, recent market declines should have reminded investors that a focus on both income and capital appreciation is a better approach to generating stable returns.

This premise is supported by the fact that over the long term, dividends have proven to be a meaningful source of stockmarket returns. Since 1900 through the end of 2015, dividends have represented nearly half of the S&P 500 Index’s total return1. Figure 1 shows the contributions of dividends relative to price appreciation in each decade since 1900. While the contribution of dividends to total return has fluctuated, the contribution throughout time clearly demonstrates that dividends have played an important role in equity total return.

US Presidential Terms and Annual S&P 500 Returns 1926-2015

Equity investors are bombarded with a multitude of statistics on a daily basis mostly showing past data. However the past does not predict the future and for the most part past performance does not mean predict the future performance of a stock. With the US Presidential election coming up, one of the many stats that often appear in the media include how well the stock market does during the rule of various presidents. People tend to infer answers to questions such as: Are Republican Presidents really good for stock market returns? or Do stocks perform better under Democrats? An article by Ken Fisher of Fisher Investments discussed this topic. From the article:

You may have heard some people claim there’s a reliable, gameable stock market pattern in US presidential terms – that some years are better than others.

You may also have heard that since 1926, every single year ending in five (1935 1945, 1955, etc) has been positive. Every one! But, you’ve also likely been warned these are silly indicators – as good as voodoo.

The ‘year five’ quirk is just that – a statistical quirk. There have been eight occurrences out of 10 since 1926. Since stocks rise more than fall, you’d normally expect at least two-thirds of those to be positive anyway.

It’s not unreasonable to expect that, with a coin weighted to show heads two-thirds of the time, all eight tosses would be heads. It happens. But it’s still just a quirk.

The following chart shows the Presidential Terms and the Annual S&P 500 Returns since 1926:

Click to enlarge

US Presidential Terms-SP500-returns

Source: Presidential term cycles are stock market voodoo: Fisher’s financial mythbusters, Aug 15, 2016, Money Observer

The entire article is worth a read.

Global Innovation Ranking 2016: China Continues To Move Higher

China is slowly becoming a leading country in innovation. Relative to its peer countries China is far ahead in innovation and R&D spending. While a few years ago the country was known as the “shopping floor for world’s manufacturing” that is no longer the case.

Because of its one-party system and the absence of some social ills that tend to affect democratic countries such as its peers Brazil and India, China is moving up rapidly in many fields. For example, it has became a leader in developing high-speed rail networks and has the world’s longest high-speed rail network. It is also advancing in space exploration. This week’s launch of quantum hack-proof communication satellite is one example.

The following infographic shows how China is leading other countries based on select metrics:

Click to enlarge

China Innovation Ranking Infographic

Source: China Daily