Deutsche Bank(DB) stock reached a record low yesterday. The largest German bank fell to its 30-year low. The US ADR plunged on heavy volume to as low $11.19.
Most of European financial institutions are still suffering since the global financial crisis of 2008-09. Political dithering and lack of effective actions by these banks have led to the sad state affairs for the once mighty banks.
I came across the following chart of Wolf Street at MarketWatch showing the dramatic decline in the share prices of Eurozone banks:
Click to enlarge
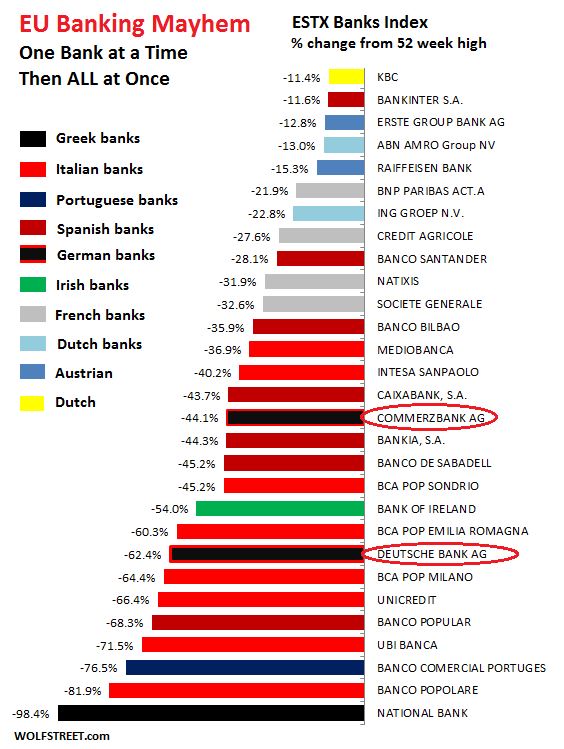
Source: Wolf Street via Deutsche Bank crisis threatens to roil global markets, MarketWatch
Disclosure: No Postiions