Why European Equities Are Lagging in Performance Compared to their US Peers

European equities are currently at a discount to their US peers.In the past, whenever  this scenario occurred European stocks have played catch and have eliminated this discount as investors gobbled up shares that were undervalued. However that is not the case in the past few years.European stocks continue -to lag US stocks for a number of reasons. Even though the EU is a single market, each individual country has its own issues including political and economic problems. For example, up until a while ago sovereign risks dominated the headlines with countries like Greece on the verge of economic collapse.That risk declined after multi-year multiple bailouts. It seemed like Europe was finally getting back on track. But then the usually calm UK erupted in chaos with the Brexit vote.Today banking issues in Germany and Italy have come to the forefront of economic issues facing the continent. With all the never-ending issues it seems like it will take a few decades or even a century for Europeans to solve their issues.

According to a report by Schroder’s political risk is weighing heavily on European stocks and as a result investors are demanding a bigger discount. In addition to the political risks, other issues like banking industry problems and deflationary risks are well known and are already priced in. It is indeed surprising that political risk usually identified with emerging and frontier markets is the major risk facing the European markets today. One factor that differentiates emerging and frontier basket-case countries from Europe is that political issues in Europe will be solved peacefully and is unlikely to lead to political revolution or a military takeover of a country. For instance, countries like Egypt or Thailand have gone from democratic to dictatorship or military almost overnight. This type of radical change will not occur in Germany or France or any other European nation. So pressure of political risks hanging over European stocks will eventually go away and they will recover to catch up with their American counterparts.

The following chart shows European stocks are lagging their US peers:

Click to enlarge
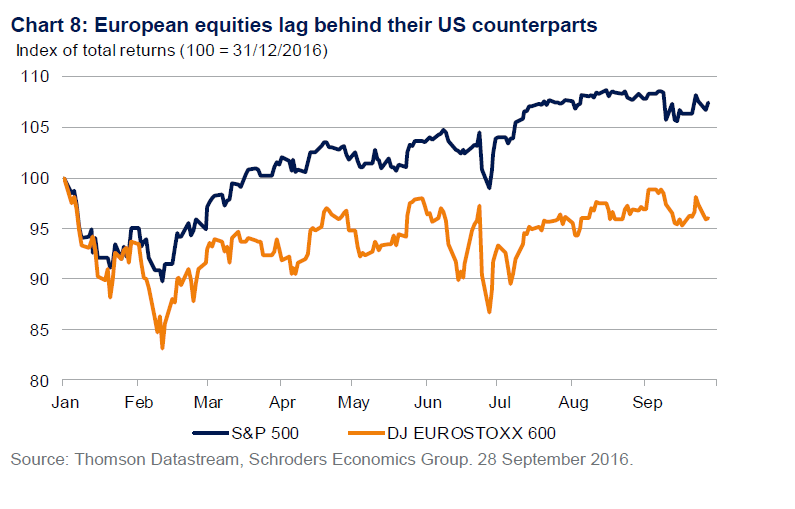
us-vs-european-stocks-performance

The table below lists seven political events that pose adverse risk to equity markets:
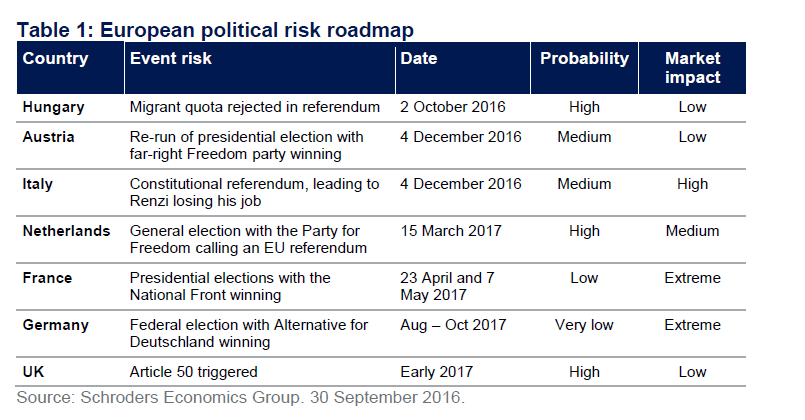
european-political-risks


Source: Schroders Economic and Strategy Viewpoint, Oct 2016, Schroders

Investors looking to take advantage of the current discount can consider the following stocks for further research:

  • Banking: ING Group (ING) – Buy with both hands under $10 per share, Nordea Bank (NRBAY), Svenska Handelsbanken AB (SVNLY)
  • Industrials: Siemens (SIEGY)
  • Chemicals: b BASF AG(BASFY), Arkema(ARKAY)
  • Auto-parts: Valeo (VLEEY), Continental AG(CTTAY)
  • Consumer staples: Nestle(NSRGY), Unilever (UL)
  • Oil: Total(TOT), Royal Dutch Shell (RDS-A) and Eni Spa (E)

A simpler and easier way to invest in major European firms is via ETFs. Two ETFs that fit the bill are SPDR EURO STOXX 50 ETF (FEZ) and SPDR STOXX Europe 50 ETF (FEU).

Disclosure: Long ING, CTTAY
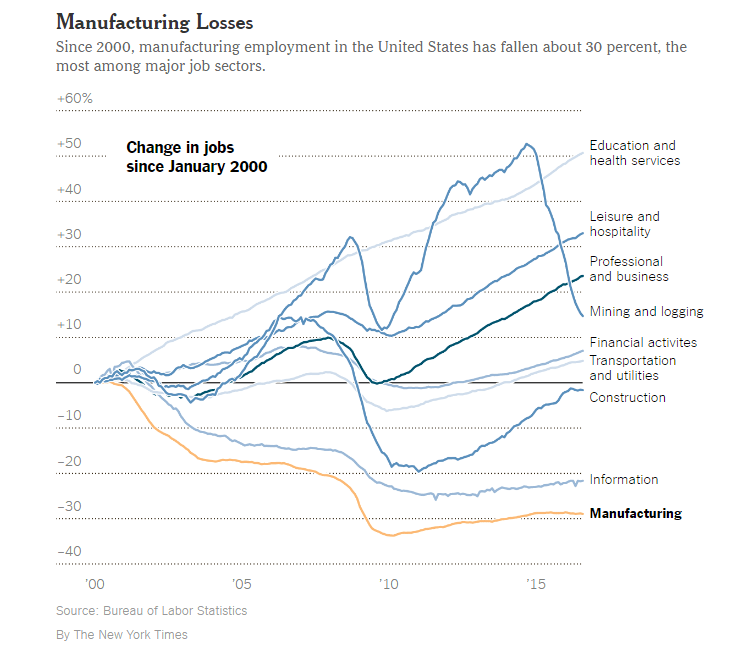
Manufacturing Industry Job Losses Since 2000

The manufacturing industry is one of the hard-hit industries in terms of employment for many decades now. In the years after World War II average Americans with low education and no college degree could live a comfortable middle-class life by getting a job in a local factory. That is no longer possible. Today most such people end up working in minimum wage jobs in retail, restaurants, etc. which will not allow a comfortable lifestyle that they desire.

According to an interesting article in the NY Times recently, globalization and automation has decimated the manufacturing industry in the US. The already suffering manufacturing sector lost an incredible 5.6 million jobs from 2000 to 2010 according to government data. For most of these displaced workers alternative employment of equal pay and benefits are not available due to failure of state policies and brutal private sector focus on the bottom line. While hard-core globalists may argue that such displaced American workers have to go where the jobs are – such as moving to China, India, Brazil or Vietnam, the reality is much different. A worker with family and deep roots in the US, cannot leave the country and move to Shenzen or Bangalore or Saigon for a job. Besides some countries have strict labor laws that ban foreign citizens from working in the country legally especially at the blue collar level. So it can be argued that such workers are effectively trapped as they have nowhere to go.

The chart below shows the decline in manufacturing  jobs since 2000:

Click to enlarge

manufacturing-industry-job-losses-since-2000

Source: More Wealth, More Jobs, but Not for Everyone: What Fuels the Backlash on Trade, NY Times, Sept 28, 2016

Here is an excerpt from the piece:

ROTTERDAM, the Netherlands — For as long as ships have ventured across water, laborers like Patrick Duijzers have tied their fortunes to trade.

He is a longshoreman here at Europe’s largest port, and his black Jack Daniel’s T-shirt, hoop earrings and copious rings give Mr. Duijzers the look of a bohemian pirate. His wages put him solidly in the Dutch middle class: He has earned enough to buy an apartment and enjoy vacations to Spain.

Lately, though, Mr. Duijzers has come to see global trade as a malevolent force. His employer — a unit of the Maersk Group, the Danish shipping conglomerate — is locked in a fiercely competitive battle around the world.

He sees trucking companies replacing Dutch drivers with immigrants from Eastern Europe. He bids farewell to older co-workers reluctantly taking early retirement as robots capture their jobs. Over the last three decades, the ranks of his union have dwindled to about 7,000 members, from 25,000.

“More global trade is a good thing if we get a piece of the cake,” Mr. Duijzers said. “But that’s the problem. We’re not getting our piece of the cake.”

The full article is worth a read.

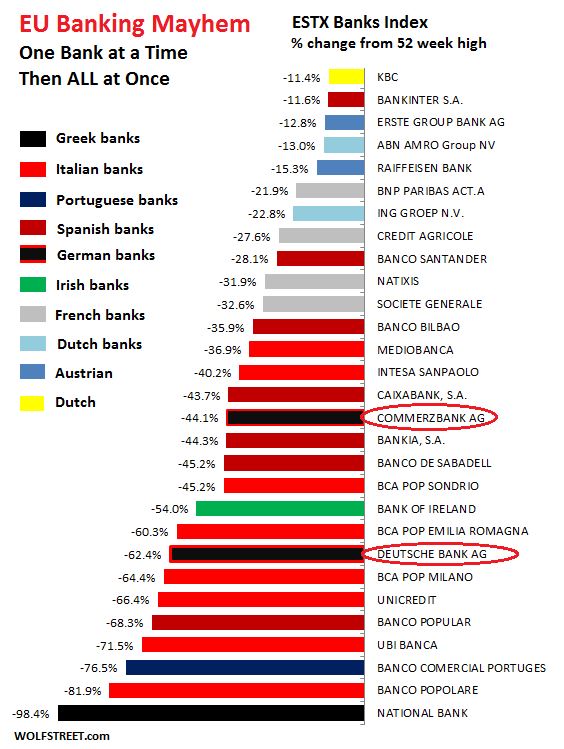
Returns of Eurozone Banks Since 52 Week High: Chart

Deutsche Bank(DB) stock reached a record low yesterday. The largest German bank fell to its 30-year low. The US ADR plunged on heavy volume to as low $11.19.

Most of European financial institutions are still suffering since the global financial crisis of 2008-09. Political dithering and lack of effective actions by these banks have led to the sad state affairs for the once mighty banks.

I came across the following chart of Wolf Street at MarketWatch showing the dramatic decline in the share prices of Eurozone banks:

Click to enlarge

eurozone-banks-chnage-since-52-week-high

Source: Wolf Street via Deutsche Bank crisis threatens to roil global markets, MarketWatch

Disclosure: No Postiions

The World’s Top 10 Tourism Destinations

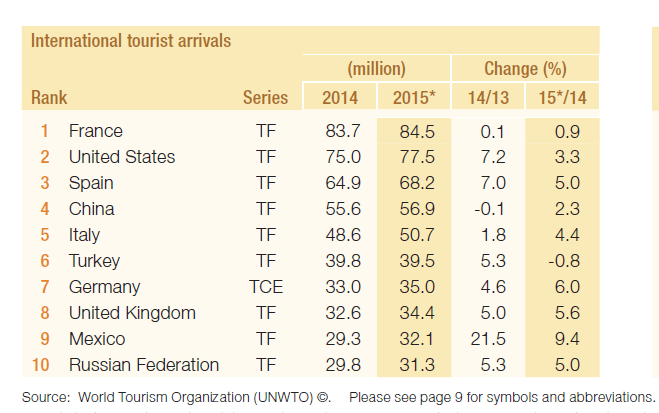
Tourism is one of the fastest growing industry in the world. Countries that offer the necessary infrastructure for tourism development reap great economic benefits. In 2015, international toursim generated US$ 1.5 trillion in export earnings according to The World Tourism Organization (UNWTO).

Among the countries visited by tourists, France tops the ranking with over 84.5 million visitors followed by the US and Spain. Of the top 10 countries, three developing countries in the list. These are China, Turkey and Mexico.

The world’s 10 most visited countries:

Click to enlarge

top-10-toursim-countries

Source: UNWTO via DW

The Top 25 Global Public Cash-Rich Companies

Public companies world-wide continue to hoard a significant portion of their assets in cash and cash equivalents rather then investing them. Large US firms are among the top hoarders of cash. There are a few logical reasons for holding cash such as taxation on profits repatriated to the US from overseas. But the negative effects of hoarding cash outweighs the positive and logical reasoning. For example, companies usually tend to waste shareholders wealth on acquiring other firms at unjustified prices just because they have tons of cash and management is incompetent to deploy it on productive purposes.

Global Finance magazine published a ranking of the world’s top 25 public firms based on cash on their balance sheet. The methodology used to select the firms:

The Global Finance Cash 25 ranks public companies by cash, cash equivalents and short-term securities on their balance sheets. Data is gathered from more than 70,000 public companies worldwide. It is a ranking of nonfinancial corporations—we exclude financial institutions from the list. Subsidiaries and nonpublic companies are excluded, and we use a minimum 25% holding for the path from a subject company to its ultimate owner as the cutoff for inclusion.

The Top 25 Global Public Companies by Cash on their Balance Sheet:

RankCompanyCountryIndustryCash^
($m)
Cash^ ($m) Previous YearChange (YoY $m)Total
Assets
($m)
1MICROSOFTUSTechnology962828546510817176223
2GENERAL ELECTRICUSIndustrial7048390025458493072
3CISCO SYSTEMSUSTechnology60416520748342113481
4TOYOTA MOTOR*JapanAutomotive43427415001927397384
5APPLEUSTechnology416012507716524290479
6JOHNSON & JOHNSONUSConsumer Products38376330895287133411
7AMGENUSBiotech3138227026435671449
8TOTALFranceOil and Gas29459264742985224484
9INTELUSTechnology253131405411259101459
10GENERAL MOTORSUSAutomotive2340128176-4775194338
11PFIZERUSPharma2329036122-12832167381
12SAMSUNG ELECTRONICSSouth KoreaConsumer Electronics23253183094944206550
13VODAFONEUKTelecoms20795158914904192587
14HON HAI PRECISION INDUSTRYTaiwanConsumer Electronics2014321572-142970038
15COCA-COLAUSBeverages1990021675-177589996
16AMAZONUSRetail1980817416239265444
17DAIMLERGermanyAutomotive1857418123451236429
18TAIWAN SEMICONDUCTORTaiwanTechnology1778513789399650292
19QUALCOMMUSTelecoms1732117565-24450796
20SONY*JapanConsumer Electronics1570318270-2566131832
21MITSUBISHIJapanAutomotive1559015663-73132436
22HYUNDAI MOTORSouth KoreaAutomotive1488319969-5085141039
23GILEAD SCIENCESUSBiotech1460710128447951716
24ENELItalyUtilities1417520727-6552175476
25GREE ELECTRICChinaConsumer Products136828928475524,90

* FY 2014, all others FY 2015  ^Includes cash, cash equivalents and short-term securities (those maturing between three months and a year).  Data valid as of July 21, 2016.

Source: The World’s Richest Companies 2016: Global Cash 25, Global Finance

A few observations:

  • US tech firms such as Cisco(CSCO), Interl(INTC), Apple(AAPL), Microsoft (MSFT) etc. hold billions in cash. Unlike other industries tech companies tend to use their cash more for growth by acquisitions than use it for organic growth.
  • Globally automotive firms also hoard large amounts of cash.
  • While large cash hoards helps management to deploy it any way they wish, they do not mean much to shareholders. In fact, some investors prefer firms to invest the cash productively or distribute them to shareholders.

Disclosure: No Positions