Equity investors are bombarded with a multitude of statistics on a daily basis mostly showing past data. However the past does not predict the future and for the most part past performance does not mean predict the future performance of a stock. With the US Presidential election coming up, one of the many stats that often appear in the media include how well the stock market does during the rule of various presidents. People tend to infer answers to questions such as: Are Republican Presidents really good for stock market returns? or Do stocks perform better under Democrats? An article by Ken Fisher of Fisher Investments discussed this topic. From the article:
You may have heard some people claim there’s a reliable, gameable stock market pattern in US presidential terms – that some years are better than others.
You may also have heard that since 1926, every single year ending in five (1935 1945, 1955, etc) has been positive. Every one! But, you’ve also likely been warned these are silly indicators – as good as voodoo.
The ‘year five’ quirk is just that – a statistical quirk. There have been eight occurrences out of 10 since 1926. Since stocks rise more than fall, you’d normally expect at least two-thirds of those to be positive anyway.
It’s not unreasonable to expect that, with a coin weighted to show heads two-thirds of the time, all eight tosses would be heads. It happens. But it’s still just a quirk.
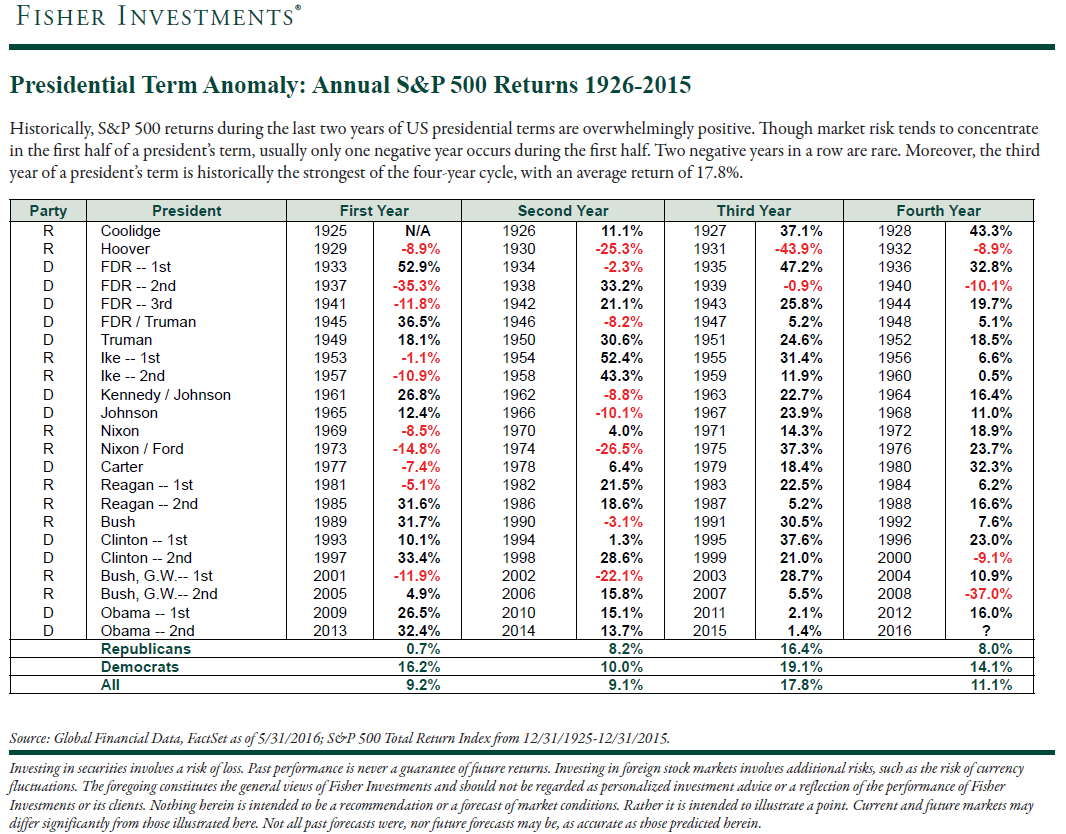
The following chart shows the Presidential Terms and the Annual S&P 500 Returns since 1926:
Click to enlarge
Source: Presidential term cycles are stock market voodoo: Fisher’s financial mythbusters, Aug 15, 2016, Money Observer


