The healthcare system in the US is the costliest in the world. Accordingly the US expenditures on healthcare is the highest in the world. The total expenditure runs into Trillions and contrary to popular belief public spending accounts for more than private spending. On a per capita basis the US spending on healthcare is more than twice the average of other developed countries.
Click to enlarge
Source: Peter G. Peterson Foundation
The question is what do Americans get for spending so much on health care? For example, do Americans get to live up to age 150 or 100 ?. The answer is an absolute no. In fact, Americans do not get their money’s worth in the health care field. This is because much of the money spent is due to highly inflated costs, administrative paperwork, marketing,outrageous compensation, etc. So in effect most of the money spent goes not towards the well being of the patient but for everything else.
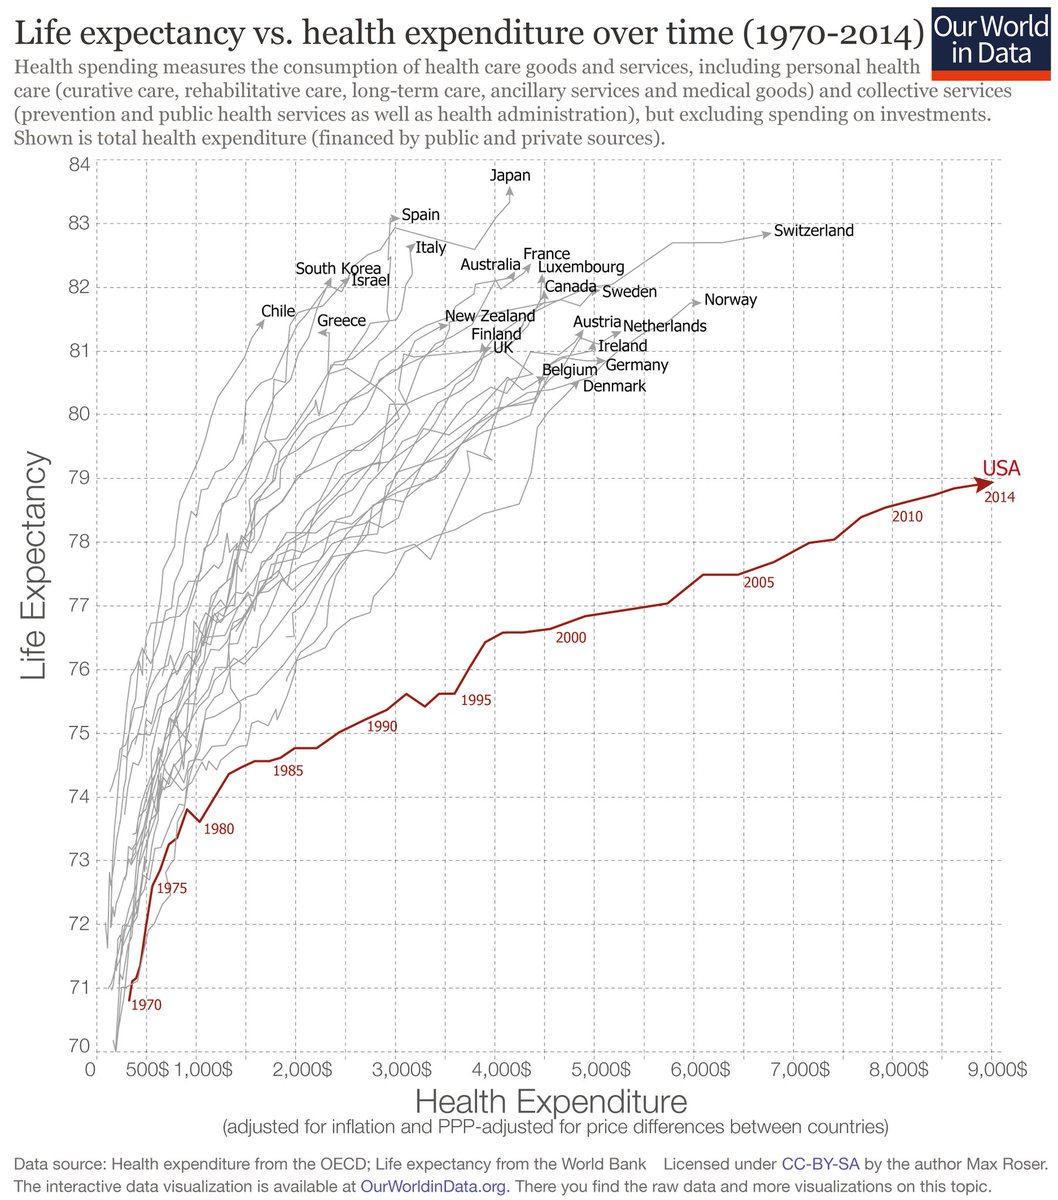
One factor which shows that the health outcome does not justify the high US expenditures is life expectancy. The US healthcare spending has been growing for many years now. But in terms of life expectancy the US ranks the lowest when compared to other developed countries as shown in the chart below.
Click to enlarge
Source: twimg.com via twitter
People in other developed countries and even in an emerging country like Chile live longer with lower health expenditures.