Total Number of Mutual Funds vs. ETFs

The ETF industry has grown tremendously in the past few years. However relative to mutual funds ETFs are still smaller in terms of total numbers of funds available on the market and the assets held in them. The following chart shows the number of mutual funds vs. ETFs:

Click to enlarge

mutual-funds-vs-etfs

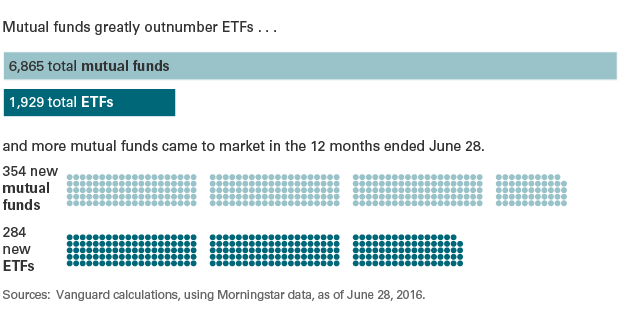
Source: Vanguard Blog for Advisors

In the US market, there were 1,929 ETFs as of June 28 this year. Though this figure looks large, the total number of mutual funds available is in the thousands. In fact, 6.865 mutual funds are now available for investors. Thats not all. In the past 12 months thru June 28, 354 mutual funds were launched while only 284 ETFs came to the market.

A few reasons why mutual funds continue to thrive over ETFs are:

  • As the name implies ETFs are designed for easier trading all day when markets are open. So investors consider ETFs to be short-term instruments while mutual funds are something that buy and forget for years.
  • Mutual funds are the main funds offered to Americans in retirement accounts such as 401K by their employers. Hence most workers are indirectly forced to invest in mutual funds than ETFs or other assets. Hence the mutual fund industry has a stranglehold on the billions of retirement assets of most people.
  • Unlike an ETF which usually track an index, many investors go with mutual funds especially actively-managed funds falsely believing that a fund manager will be good enough to outperform the market. The mutual fund industry continues to convince Americans thru misleading marketing that star-fund managers are better at investing than ETFs or even individual investors building a portfolio themselves.

Some of the large ETFs on the US market include:

  • Vanguard Dividend Appreciation ETF (VIG)
  • SPDR S&P Dividend ETF (SDY)
  • SPDR S&P 500 ETF (SPY)
  • iShares MSCI Emerging Markets ETF (EEM)
  • Vanguard MSCI Emerging Markets ETF (VWO)

Disclosure: No Positions

Brazil: One of the Top Performing Stock Market So Far This Year

Brazil is the top performing market in the world so far this year. The Bovespa has shot up by 41% year-to-date,

The Olympics and more importantly the ousting of the Dilma Roussef government a while ago by a more pro-growth conservative administration made foreign investors turn their attention to Brazilian equities again.

Bovespa year-to-date return chart:

Click to enlarge

bovespa-1-year-returns

Source: Google Finance

The iShares Brazil ETF(EWZ) is a simple way to invest in Brazil. For investors looking to invest directly in individual companies a list of ADRs trading on the markets can be found here.

Disclosure: No Positions

Infographics: Building Wealth in Equity Investing Needs Patience

Timing the market never works. Investors looking to earn higher than average returns and build wealth by investing in stocks need patience. This involves the ability to stay put and not sell out when markets crash. Holding high-quality stocks for the long-term measured in decades and sitting tight during bull and bear markets is a successful strategy to build wealth.

The following infographics from Schwab demonstrates this concept:

Click to enlarge

infographics-patience-wins-in-stock-market-investing

Source: When Markets Dip, Don’t drop Out, Charles Schwab

Long-Term Investors Can Consider U.S. Utility Stocks Now

Utility stocks were the top performers in the first half of this year rising 21%. However they have declined substantially since June 20th with a loss of 10%. Overall the Dow Jones Utility Average Index-is up only 12.01% year-to-date.

Fear of rising interest rates led investors to dump income stocks such as utilities.While short-term volatility is understandable investors willing to take a long-term approach of 5 years or more can consider adding them in a phased manner. Even when interest rates increase, yield hungry investors will continue to look for income producing equities and utilities fit the bill. Unlike the chaotic European utility industry, US utilities are highly regulated and many are a monopoly in the markets they operate.

The following are ten US electric utilities with their current dividend yields:

1.Company: Duke Energy Corporation (DUK)
Current Dividend Yield: 4.51%

2.Company: NextEra Energy Inc (NEE)
Current Dividend Yield: 2.87%

3.Company: Dominion Resources, Inc. (D)
Current Dividend Yield: 3.91%

4.Company: Southern Company (SO)
Current Dividend Yield: 4.53%

5.Company: Exelon Corporation (EXC)
Current Dividend Yield: 3.96%

6.Company: American Electric Power Co. (AEP)
Current Dividend Yield: 3.65%

7.Company: PG&E Corporation (PCG)
Current Dividend Yield: 3.33%

8.Company: PPL Corporation (PPL)
Current Dividend Yield: 4.72%

9.Company: Public Service Enterprise Group Inc. (PEG)
Current Dividend Yield: 4.04%

10.Company: Edison International (EIX)
Current Dividend Yield: 2.77%

Note: Dividend yields noted above are as of Oct 12, 2016. Data is known to be accurate from sources used.Please use your own due diligence before making any investment decisions.

Disclosure: Long NEE

Infographics: The US Stock market and Election Cycles

The US Presidential Election is in full swing with both the candidates trying hard to gain voters.The equity market does not care whether a Republican or a Democrat ends up in The White House. To that end, Charles Schwab published the following infographic showing the performance of stock markets during presidential election cycles.

Click to enlarge

the-us-stock-market-and-election-cycles

Source: The Stock Market and Election Cycles, Charles Schwab, Oct 12, 2016