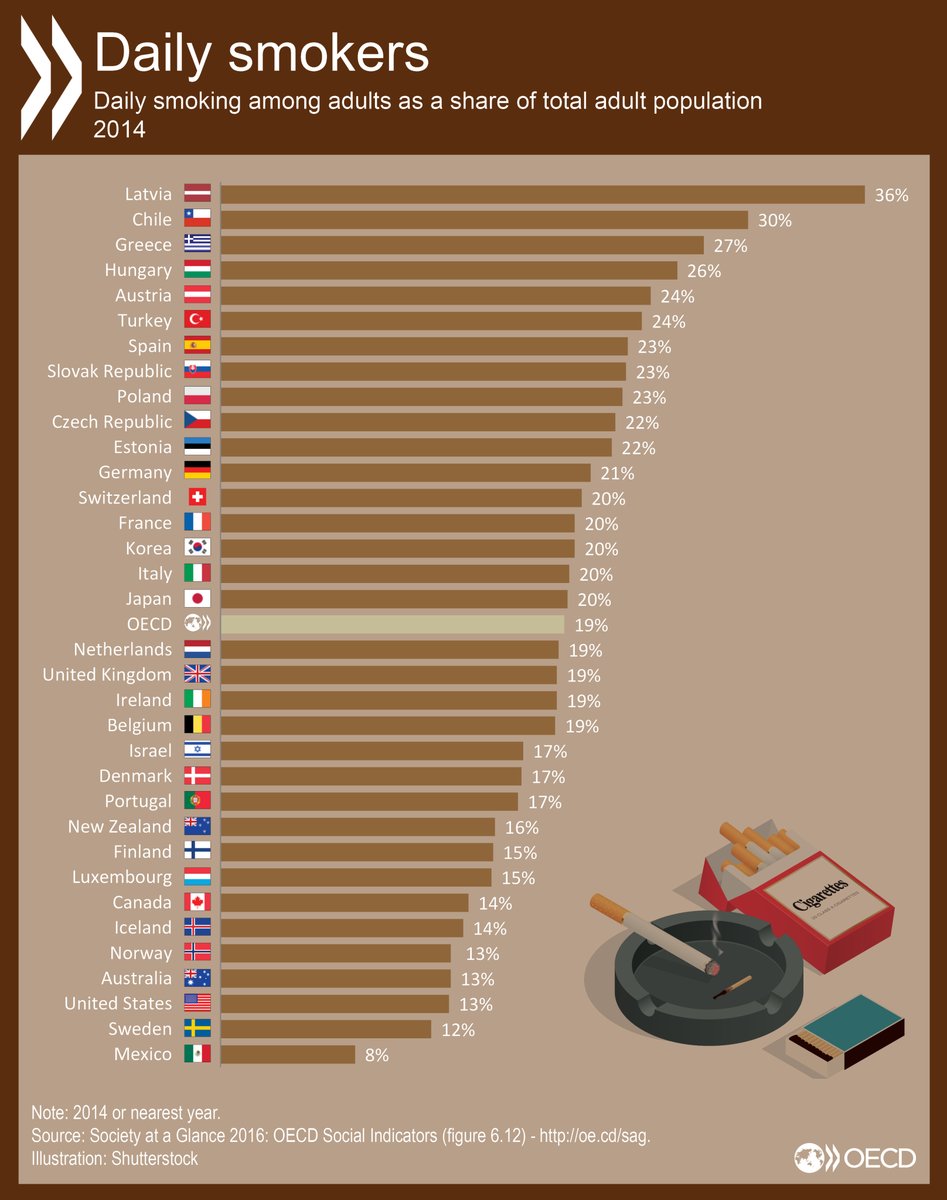
Percentage of Daily Smokers As a Share of Total Adult Population in OECD Countries

Smoking rates have declined by one fourth since 2000, according to a report by the OECD. About 19% of the daily population smoked daily in 2014, the latest year for which data is available. But the rate varies widely across OECD member nations.

Click to enlarge

percentage-of-smokers-in-oecd-countries

Source: OECD

The former Soviet republic of Lativa has the highest percentage of smokers at 36% and Mexico has the lowest at just 8%. The average OECD rate is 19%. Next to Mexico, Sweden and the US have the lowest rates. Smoking rates are lower in Scandinavian countries.

Despite the decline in OECD countries, global tobacco  giants are growing and their profits are going up. This is because while sales is declining developed countries they are soaring in developing countries. Tobacco usage is increasing in emerging countries like China, Indonesia, India, etc.

Last  week Britain-based British American Tobacco Plc(BTI) offered to buy the rest of Reynolds American Inc(RAI) that it doesn’t already own. In general major tobacco firms are the favorite of income seeking investors. Other companies in the tobacco industry include Philip Morris International, Inc.(PM), Imperial Tobacco PLC (ITYBY), Altria Group Inc.(MO),  and Lorillard, Inc.(LO).

Related:

Disclosure: No Positions

On The Monopoly and Oligopoly Madness In Most US Industries

The US is considered as the most competitive market in the world. However in reality most of the major industries are a form of monopoly or oligopoly. When industries are dominated by one company or a handful of companies customer suffer as prices inevitably increase due to pricing shower and lack of competition. But investors and management in these firms benefit as profits rise.

I written about the scourge of  monopolies and oligopolies in the airline, railroad, cable tv, ratings industries before. Other industries such as auto manufacturing, bus transportation, passenger rail transportation, food, healthcare, entertainment, media, etc. are also plagued by this phenomenon. But somehow this setup is accepted by the state and the public. And then the same public wonders why customer service is awful in most companies, why wages are stagnant, why the rich get richer and the poor get poorer, why bills keep going up and up every year, why politics is corrupted by big money, etc.

Yesterday news broke that the telecom giant AT&T(T) is going to acquire cable TV giant Time Warner(TWX). If this deal goes thru it will be another nail in the coffin for competition. Already most cable companies including Comcast(CMCSA) are notorious for price gouging and bad customer service. This merger, if approved by regulators, would further hurt American consumers.

The following chart shows the evolution of AT&T and Time Warner:

Click to enlarge

att-and-time-warner-combination-chart


Source: AT&T Is in Advanced Talks to Acquire Time Warner, WSJ, Oct 21, 2016

Disclosure: No Positions

Public Social Spending as a Percentage of GDP Across OECD Countries

Social spending includes various benefits offered by a country to its residents such as healthcare, pensions, social security,  food stamps, relocation money provided to refugees, funding for community activities for illegals, etc. This expenditure varies widely across OECD member countries.

Click to enlarge

social-spending-across-oecd-countries

Source: OECD

France tops the list with social spending amounting to over 31% of the GDP and Mexico spends the least at 7.5%. The US spends slightly less than the OECD average of 21%.

Debt to Savings Ratio As a Percentage of GDP of Select Countries

China is creditor country while the US is the largest debtor country in the world. China has also one of the low debt to savings ratio in the world as shown in the chart below:

Click to enlarge

debt-to-savings-ratio-of-select-countries

Source: 5 Big Risks Posed by China (And Why They Shouldn’t Crash Global Markets in 2017) by Michelle Gibley, Charles Schwab

China’s debt to savings ratio(as a % of GDP) is especially low when compared to developed countries.

Why International Diversification Is Necessary

US stocks have performed well in the past few years relative to other developed and emerging stocks. Emerging market stocks have been especially poor performers for many years until now.

While the S&P 500 is up by about 7% so far this year, emerging markets such as Brazil, Russia have soared by 42% and 30% respectively. Among the developed European markets, most are under-performing the US with the exception of UK where the FTSE 100 has gone up by over 12% year-to-date.

In general, though US outperform foreign stocks it does not mean one should ignore foreign stocks. US stocks outperform in some years while foreign stocks in some others. Nether US or international stocks continuously remain the top performer year over year.

The following chart proves the above concept:

Click to enlarge

internatonal-vs-us-stocks-performance-differential

SourceVanguard Blog for Advisors

So the key takeaway is that investors should diversify internationally and not just focus on US stocks alone.

Related ETFs:

  • Vanguard Dividend Appreciation ETF (VIG)
  • SPDR S&P Dividend ETF (SDY)
  • SPDR S&P 500 ETF (SPY)
  • iShares MSCI Emerging Markets ETF (EEM)
  • Vanguard MSCI Emerging Markets ETF (VWO)

Disclosure: No Positions