Innovation is an important determinant of a country’s economic growth. Hence high investment in R&D must be encouraged both by public and private institutions. The US traditionally leads the world in innovation in many industries. Countries in Europe are the next in coming up with world-class innovations. But among the European countries which countries are lead and which countries lag in innovation?
The European Innovation Scoreboard for 2016 published earlier this year by the European Commission(EC) provider the answer. From an EC report on the scorecard:
The European Innovation Scoreboard – previously Innovation Union Scoreboard – provides a comparative analysis of innovation performance in EU Member States, other European countries, and regional neighbours. It assesses relative strengths and weaknesses of national innovation systems and helps countries identify areas they need to address.
The Regional Innovation Scoreboard is a regional extension of the European Innovation Scoreboard, assessing the innovation performance of European regions on a limited number of indicators.
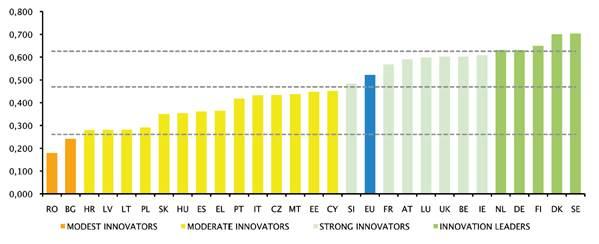
The chart below shows the ranking of EU countries for innovation:
Click to enlarge
Infographic:
Source: European Innovation Scoreboard, EC
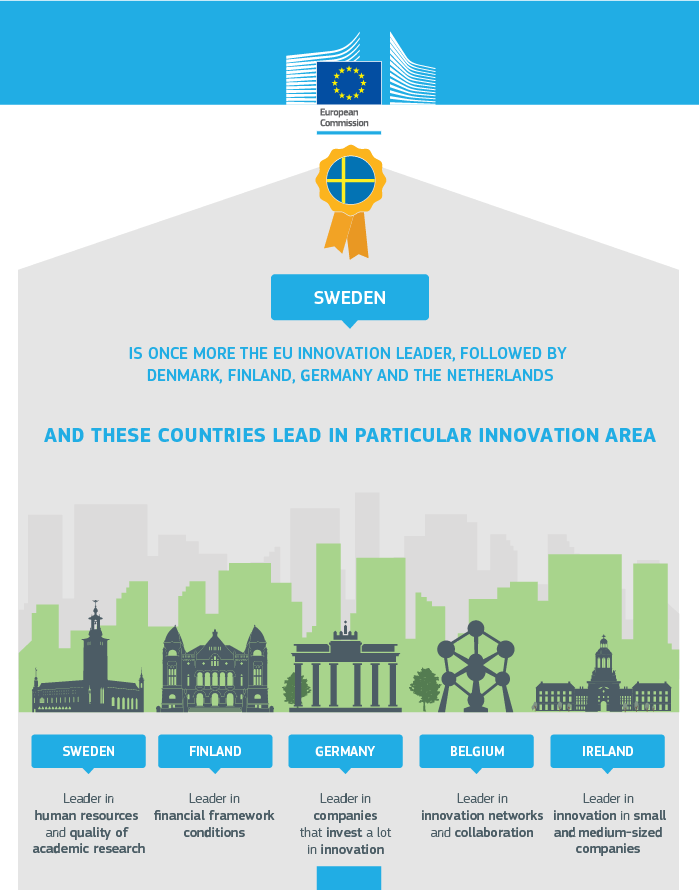
Sweden tops the EU countries in innovation leader followed by Denmark, Finland, Germany and the Netherlands. If neighboring countries are included Switzerland is the most innovative country.
Sweden is home to world-class innovators such as Ikea and Spotify and Skype. The country is home to many of the successful companies in the high-tech industry like King, the creators the highly popular Candy Crush game.
With the exception of Germany, the larger countries of Europe – Spain, France, the UK – lag the smaller Scandinavian countries.