Who Pays More US Federal Income Taxes – Individuals or Corporations?

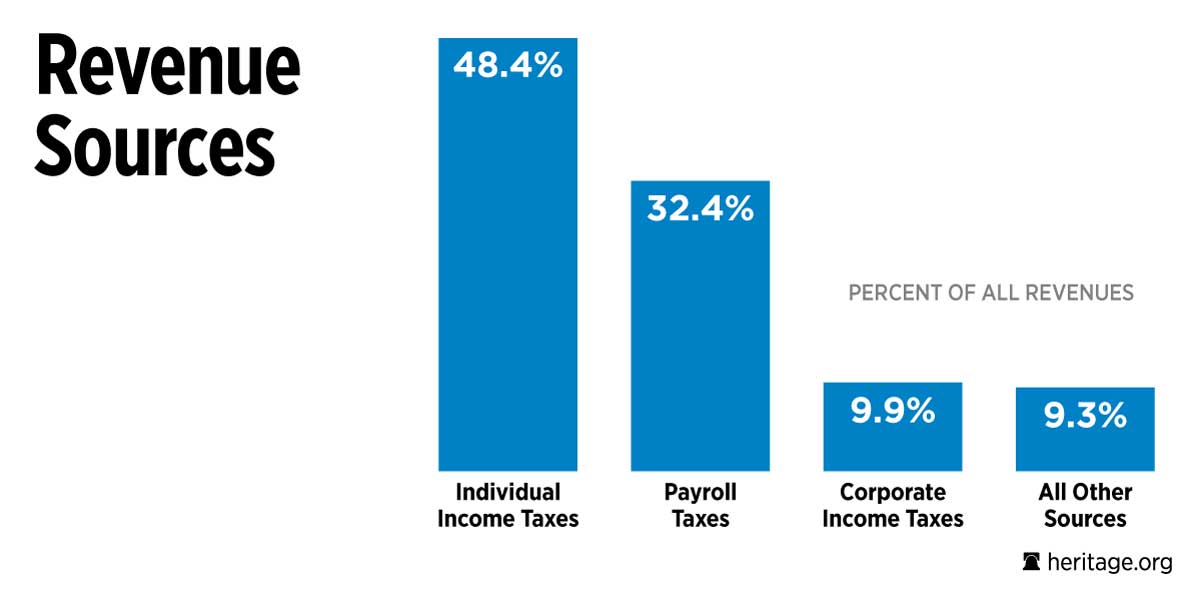
The US Federal government collects more taxes each year from individuals than corporations in the form of income taxes. This may be surprising to some people since the US corporate income tax is one of the highest in the world and companies earn far higher earnings as profits than most individuals.

The following chart shows that nearly half of the Federal revenues come from individual income taxes:

Click to enlarge
federal-tax-sources

Source: The Heritage Foundation

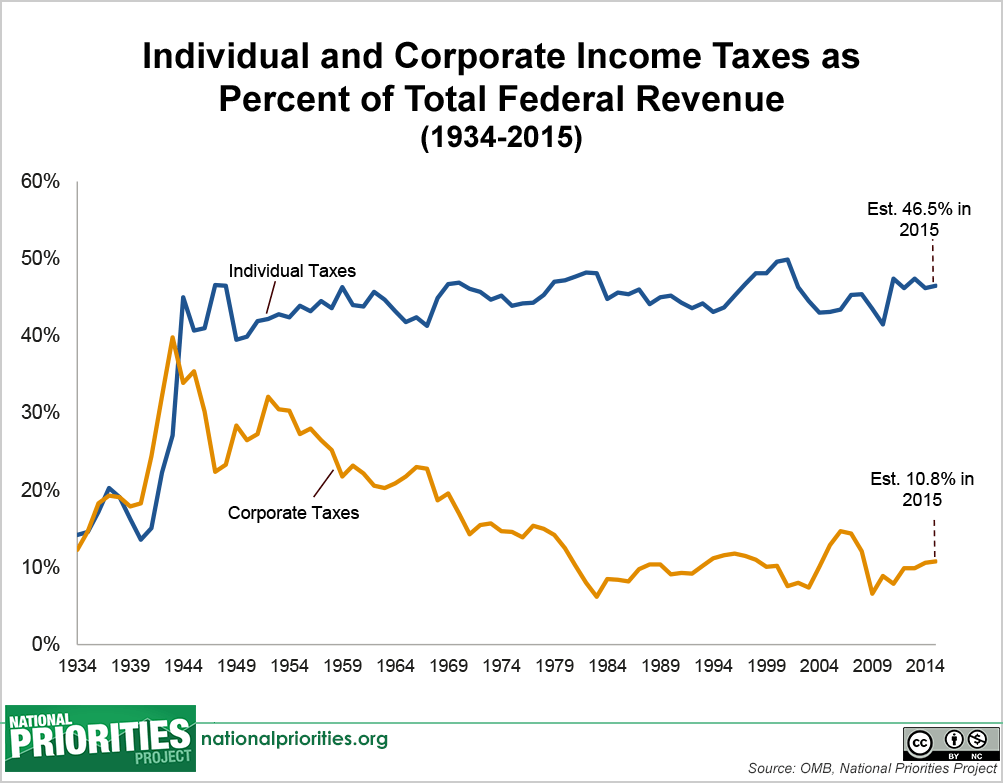
To put the above figures in perspective, in the fiscal year 2015 the total federal revenues were expected to be $3.18 trillion according to the National Priorities project. Out of this, individuals paid $1.48 Trillion in income taxes (47% of total). Corporations on the other hand paid just $341 billion (11% of total revenues).

Why do corporations pay less income taxes than individuals?

Though the corporate tax rate is 35%, most US companies pay much less.  This is because of the millions of legal loopholes that are available for corporations in the tax code. Using an army of corporate lawyers, tax attorneys, accountants, lobbyists, consultants and other professionals whose only job is figure out how to legally reduce the taxes owed by a corporation to the minimum possible. Unlike corporations most individuals do not have the resources to hire all these folks to prepare their taxes. In addition, many of the thousands of loopholes that are afforded to corporations are not available to individuals. For example, Uncle Sam allows firms to use tax-avoidance tools like a Dutch Sandwich, Double Irish arrangement, etc. to shelter billions in taxes owed. As a results, corporate income taxes as a percentage of total federal revenues have declined year after year since the 1940s compared to individual income taxes.

Click to enlarge
individual-and-corporte-income-taxes-since-1934

Source: Federal Revenue: Where Does the Money Come From, National Priorities Project
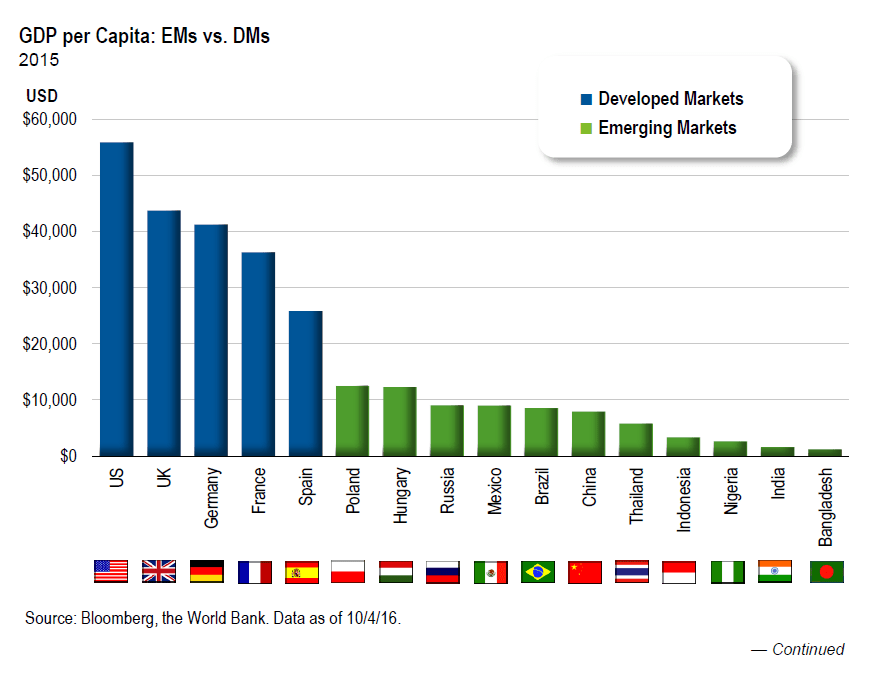
GDP per Capita: Select Developed vs. Emerging Countries

Emerging markets have still a long way to go before they catch up with developed markets in terms of GDP per capita. This figure is calculated by taking the overall GDP of a country and dividing it up for each individual in the country.

Despite explosive growth in emerging markets in the past few decades, the GDP per capita in those countries as still low relative to developed markets. For example, Germany’s GDP per capita is over $40,000 but China’s GDP is still under $10,000. China was and is still considered one of the top fast growing emerging countries. Hence most people in China are still poor financially speaking relative to developed countries.

Click to enlarge

gdp-per-capita-developed-vs-emerging-countries

Takeaway for investors:

Because emerging countries have lower GDP per capita investors should not assume that people in those countries would be able to consume goods and services like those residing in developed countries. So for instance, though someone in the US may easily spend $4 or $5 for a cappucino at Starbucks(SBUX), the same may not be true in Brazil, China, India, Indonesia, etc. That does not mean nobody can afford to spend that much on a coffee in those countries. It is just the majority of the population cannot afford to spend that much on a coffee. Hence investors must consider carefully before investing in developed world companies that cater to emerging market consumers.

Source: 2017 GLOBAL INVESTMENT OUTLOOK, Franklin Templeton Investments

Disclosure: No Positions

Knowledge is Power: Successful Investor Habits, World’s Safest Banks 2016, US Stock Valuation Edition

Earlier:
Knowledge is Power: Monopsony, Coal, Anti-Globalization Edition (TFS)

train-in-wales-uk
Train in Wales, UK

Japan: The Relationship Between Interest Rates And Stock Market Performance

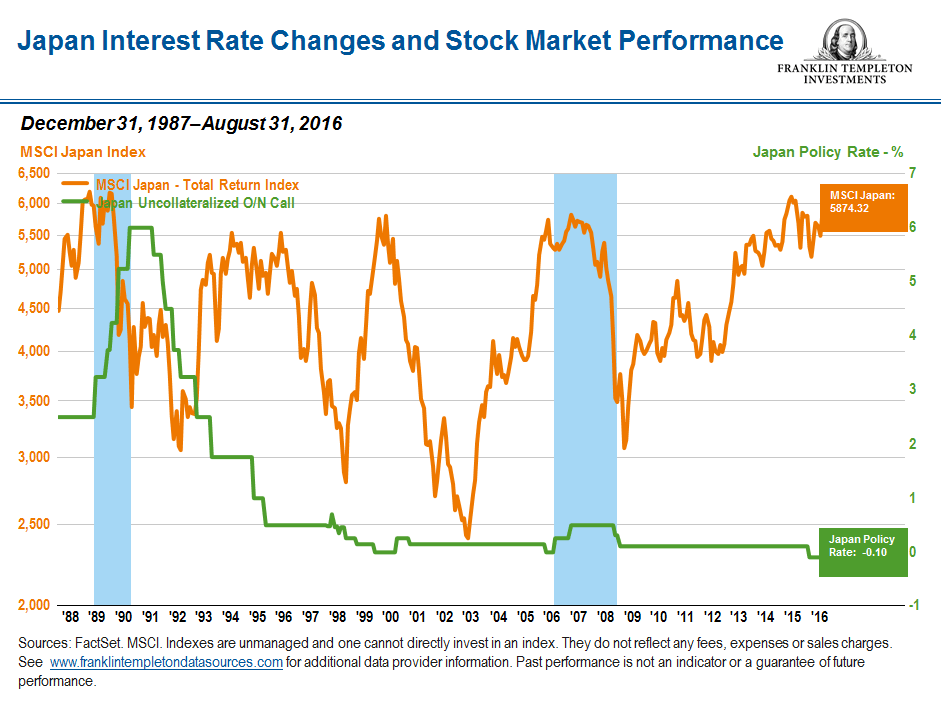
The impact of falling and rising interest rates on equity markets vary by country. Stocks do not always rise when interest rates fall and vice versa. In the case of Japan, an article by Franklin Templeton Investments noted that falling interest rates did not lead to positive long-term performance of the equity markets.

The benchmark index topped out at over 37,000 in Jan, 1990. This past Friday it closed at 18.381. So after more than 25 years the Nikkei is still lower than where it was back then. Anyone who bought stocks at that peak are still sitting on a loss.

The chart below shows the changes in interest rates and the equity market performance using the MSCI Japan Total Return Index:

Click to enlarge

msci-japan-index-vs-interest-rate

From the article:

The BOJ has become a top shareholder in the one of the world’s largest equity markets and already is one of the top five owners of 81 companies listed on Japan’s Nikkei 225 Index.2 The central bank is also on its way to becoming the number one shareholder of more than 50 of those firms, according to various estimates. Market bulls are happy with the BOJ purchases, but opponents say the central bank is artificially inflating valuations and ironically discouraging companies from becoming more efficient. Interestingly, Japan’s Nikkei 225 Stock Average is actually down more than 8% year-to-date, although one might argue its fate could have been worse without central-bank buying.3

2. Ibid.

3. Source: Bloomberg, as of November 1, 2016. Indexes are unmanaged and one cannot directly invest in an index. They do not reflect any fees, expenses or sales charges.

Source: Central Banks and Stock Markets: a BOJ Case Study,  Franklin Templeton Investments, November 22, 2016

A few points to remember about the Japan equity market:

  • Foreign investors are big owners in the domestic stock market. So stocks tend to follow the whims of these investors. So in this scenario, Japan is more of an emerging or frontier market than a developed market like the UK, Canada, USA, etc.
  • Retail investor participation in Japan is very low by developed market standards. So years of stocks going nowhere does not affect the average citizen.
  • Japanese companies tend to give lower priority to shareholders than other stakeholders.
  • Dividend yields of stocks also are low relative to other major markets. The dividend for the Nikkei was just 1.83% in July, 2016.

Related ETFs:

  • iShares MSCI Japan ETF (EWJ)

Disclosure: No Positions


The Average Tenure of a Company in the S&P 500 Index

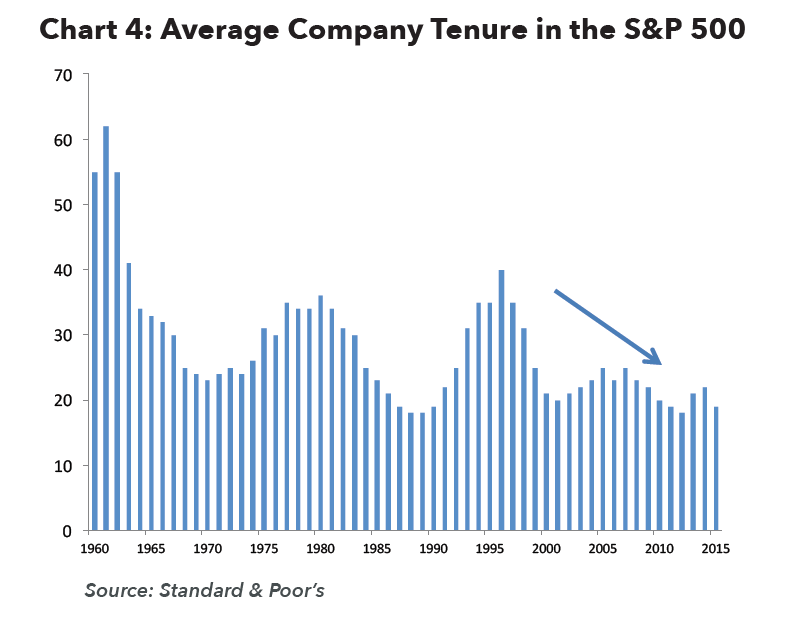
cThe average tenure of a company in the S&P 500 Index has declined consistently for years now. The average tenure has fallen from 40 years to less than 20 years now.

Average Tenure of a company in the S&P 500:

Click to enlarge

average-company-tenure-in-the-sp-500-chart

Source: Navigating Macro Choppiness, The Fiduciary Group

Companies get booted out of the benchmark for many reasons including going bankrupt, mergers & acquisitions, going private, technological advancements, etc. The only change in the index is constant. For example, companies tech firms like Apple(AAPL), Amazon(AMZN), Facebook(FB), are in the top 10 constituents of the S&P 500 today. However they may or may not exist in the index 20 or 30 years now as competitors can unseat them or they can be made irrelevant by newer technologies. Things like social media may be hot now but may be totally forgotten 20 years from now as consumers eventually move on to some other fad.

Related ETF:

  • SPDR S&P 500 ETF (SPY)

Disclosure: No Positions