Breakdown of Apple iPhone 7 Retail Price

Global trade is important in the modern era. With globalization, goods are moved across borders benefiting many countries during the process.

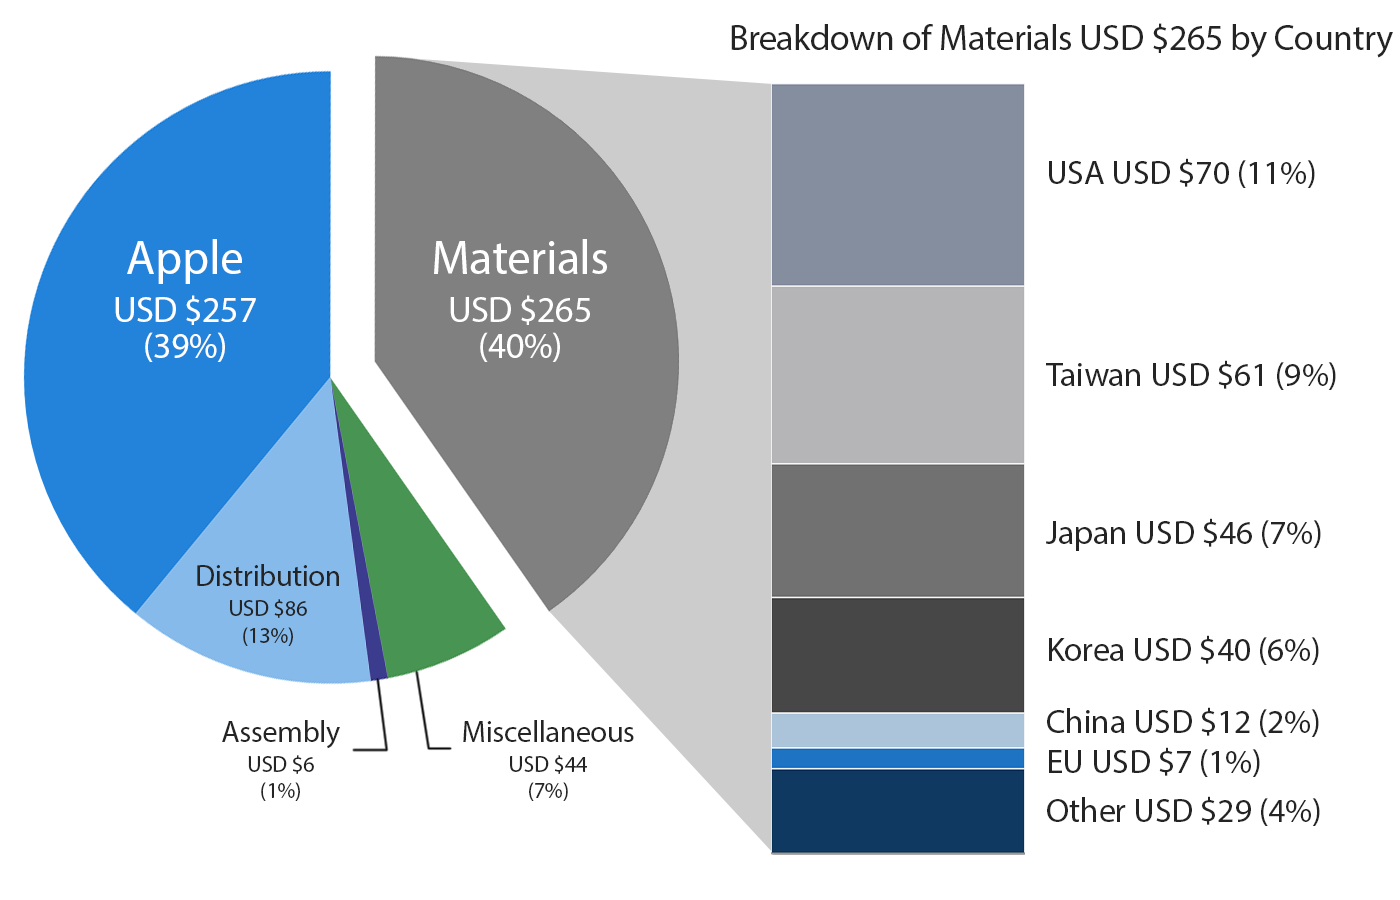
The breakdown of a popular product such as iPhone 7 shows the benefits of global trade. The phone sells for $658 in the U.S. Of this, about 40% or 257$ goes to Apple(AAPL) and other U.S. companies make $70 ( or 11%) out of it. So in total, about half of the cost of the iPhone goes to US firms.

Component makers Korea, Taiwan and Japan take 6%, 9% and 7% respectively. China, the assembler and shipper of the product gets only 2% of the retail price.

So in summary, just 2% of an iPhone’s price goes to China. Though China is blamed for the destruction of US manufacturing jobs and profiting from it, at least in the case of Apple’s iPhone the biggest gainer is US and not China.

The following chart shows the breakdown of iPhone 7 price:

Click to enlarge

Source: The Real Trade Warby Yu-Ming Wang, Global Head of Investment and Chief Investment Officer, Nikko Asset Management

Also see: Breakdown of an Apple iPhone 5 Component Costs, TFS

Update:

Global iPhone Supply Chain

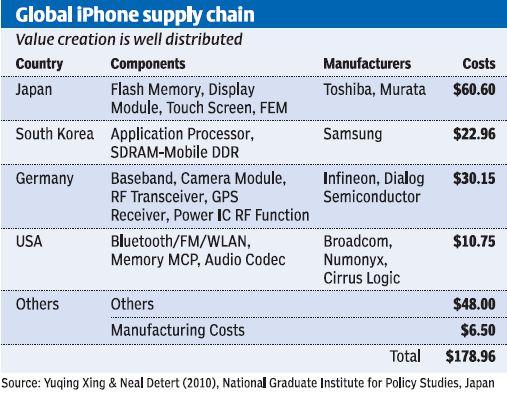
Source: The Hindu BusinessLine

Disclosure: No Positions

International Investing: Why Diversify Across Borders?

One of the topics that I have covered many times on this blog is the benefits of international diversification. No country or region is the top performing consistently year after year. So while the U.S. market has done well in recent years, over time other markets have been top perfomers in one year than the U.S.

A popular tool that clearly shows the advantages of diversification is The Callan Periodic Table of Investment Returns. Recently I came across another chart from Schwab showing why diversification across borders is beneficial. The following chart displays the annual returns in 11 regions/countries from 2006 thru 2016:

Click to enlarge

Source: Why Global Diversification Matters, Schwab

Of the countries/regions shown above, Canada was the worst market in 2015 but was the best in 2016 when oil prices rebounded sharply. Similarly in 2012, German stocks returned 32% or double the returns when compared to US stocks (16%).

In addition, for the noted period the US market was the best performer only in 3 years.

So U.S. investors have to diversify their holdings globally in order to capture from the growth potential of other markets.

Credit Suisse Global Investment Returns Yearbook 2017: A Short Review

Credit Suisse published the latest edition of their famous Credit Suisse Global Investment Returns Yearbook 2017 last month. Unlike the previous years, the free version available online is this year is the summary edition. Investors can find a fascinating collection of investment stats in this yearbook. The following are two charts from this year’s edition.

1.Relative Sizes of World Stock Markets: 1899 vs.2016:

Click to enlarge

2.  Industry weights in the USA and UK, 1900 compared with 2017

Download: 

Source: Credit Suisse

Also see: 

FTSE 100 Exposure by Geographic Revenue vs. Domicile

The British equity market has recovered strongly since the Brexit decision early last year. One of the main reason for the resilence of British stocks is that most of the revenues of the FTSE 100 firms come from abroad. As a result, the FTSE 100 firms are dependent on the economies of foreign countries than the domestic market. Due to its former colonial roots many of UK’s top multinational firms have strong presence in other countries especially in emerging countries which used to be ruled by the British. Some of these multinational firms such as Unilever(UL) and BP(BP) have had operations in emerging markets since the 19th century.

In general, investing in FTSE 100 companies is more of a bet on other countries than the UK.  According to an article at Schroder’s only 29% of the revenues of FTSE 100 firms come from the UK.

The following graphic shows the revenue source for FTSE 100 firms by country/region:

Click to enlarge

Source: The road to Brexit: what’s next for investors?, Schroder’s

The US is a top market for Footsie firms than France and Germany.

Related ETF:

  • iShares MSCI United Kingdom Index (EWU)

Disclosure: No Positions


Potential Winners and Losers from Trump’s Policies

The following is a simple chart showing potential winners and loser’s from Trump’s policies:


Source: Evaluating the Trump Effect on Global Equities by Mark Phelps, Dev Chakrabarti, AB Blog, Mar 2, 2017

According to the authors of the above article, US small and mid-caps appear attractive based on three major variables—tax cuts, tariffs and the US dollar, as they focus on the domestic market.

Also seeRBC: 20 Canadian Stocks To Gain From Trump’s Policies