Stocks in the Euro Zone are still lagging behind in terms of recovering previous losses. For instance, the benchmark Euro Stoxx 50 index has still not reached the peak attained before the Global Financial Crisis of 2008-09 as shown in the chart below. In addition, the record high of 5,405 before the dot com bust still remains the highest peak.
Click to enlarge
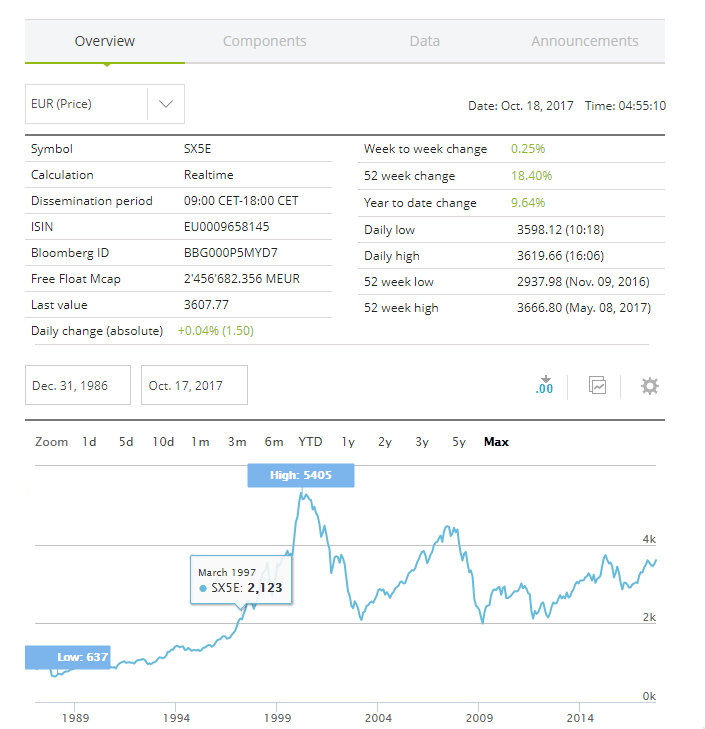
Source: Stoxx
Related ETF:
- The SPDR EURO STOXX 50 ETF (FEZ)
Disclosure: No Positions