Contract Research Organizations (CROs) play an important role in medical innovation as more pharmaceutical, biopharmaceutical and medical device companies outsource many of their R&D activities. The top 10 global CROs are listed in the chart below.
Here is a brief overview of the CRO industry:
In 2017, the global CRO services market is estimated to be valued at USD 36.27 Billion and projected to grow at a CAGR of 7.6% from USD 39.13 Billion in 2018 to reach USD 56.34 Billion by 2023. Globally more than 1,100 CRO companies are active in 2017. The global CRO market is centralized with the top 10 companies that generated collective total revenue of USD 34.514 billion in 2017 (including reimbursed out-of-pocket revenue). The global contract research market is growing at a strong rate as increased dependence of pharmaceutical, biopharmaceutical and medical device companies seen due to increased outsourcing of R&D activities, increased R&D expenditures and, increasing number of clinical trials.
The leaders in this market include a mix of public-listed and privately held organizations. Recent collaborations by CRO companies with government agencies and non-profit health organizations has proved that CROs are not just clinical service providers but actively involved in the new drug development process, and immensely contributing to the development of new products and helping advancement in healthcare outcomes.
Click to enlarge
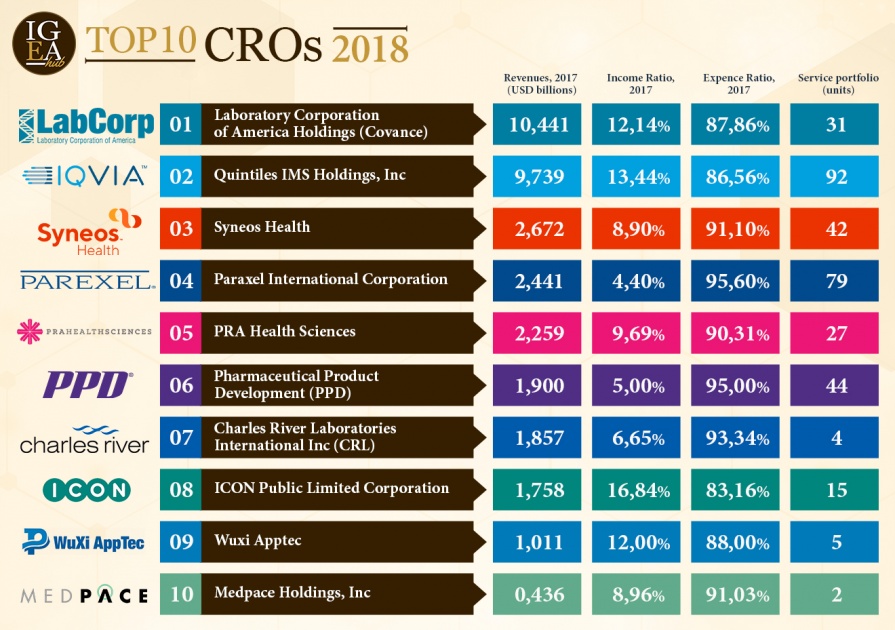
Source: IGEA Hub
Some of the publicly-listed companies from the above rankings are Laboratory Corp. of America Holdings(LH), Charles River Laboratories Intl. Inc (CRL) and Iqvia Holdings Inc(IQV).
From an investment perspective, the CROs are a better bet than drug and biotech firms since they provide a service and are not dependent hugely on the discovery or success of a drug for example.
Earlier:
Disclosure: No Positions