Knowledge is Power: Bubble Spotting, Black Sea Facts, Trends Investing Edition

Welcome to the Jungle that is the US equity market ! “Markets can remain irrational longer than you can remain solvent” said the great British Economist John Maynard Keynes. In wacky times such as now, the trick to keep calm when markets go crazy and carry on with the long-term goal in mind.

Below are a few interesting reads from the web:

Old Town Square, Prague, Czech Republic

Could the US Go from Worst To First in Crushing Covid-19?

The total number of people infected with Covid-19 is over 25.4 million as of Jan 26, 2021. The death toll has reached 425,208 according to data compiled by the NY Times. While a few months ago it seemed that there was no end in sight to this immense tragedy, it is now possible to imagine a victory over the coronavirus. An interesting article in The Asia Times noted that the US may to be first Western country to crush Covid-19. From the article:

Europe’s bungled rollout of coronavirus vaccines makes it likely that the United States will be the first big Western nation to eliminate the Covid-19 pandemic, German immunologists told Asia Times in interviews this week. Although Germany showed much lower infection and mortality rates during the first wave of the pandemic in the spring of 2020, Europe’s failure to source and distribute vaccines on a scale sufficient to dent the pandemic gives the United States a clear lead.

The US is vaccinating its population at three times the rate of France and Germany, according to the Our World in Data website. The only country acting faster is the United Kingdom, with a daily vaccination rate of 0.5 doses per 100 people.

A combination of vaccination and past infection may immunize two-thirds of America’s population against the virus by the middle of 2021, one German virologist explained. That should be sufficient to give America “herd immunity,” slowing the future spread of the virus to very low levels. With 25 million confirmed cases and over 150,000 new cases per day, the United States will have more than 50 million inhabitants with resistance to the virus due to past exposure. The US has vaccinated 20 million people in under four weeks, and at the present rate of six million vaccinations per week, an additional 170 million Americans will be resistant by the end of the second quarter of this year. By that projection, 220 million of America’s 330 million inhabitants, or two-thirds of the total, will be resistant, and America will achieve herd immunity.

Virologists believe that  “herd immunity” will be achieved when somewhere between 43% and 60% of the population becomes resistant to COVID-19.

Source: US likely to be first Western nation to crush Covid-19, Asia Times, Jan 27, 2021

Economic professor Alex Tabarrok at George Mason University also predicts the US will win over the virus this year. Below is an excerpt from his post at The Marginal Revolution :

By July it will all be over. The only question is how many people have to die between now and then?

Youyang Gu, whose projections have been among the most accurate, projects that the United States will have reached herd immunity by July, with about half of the immunity coming from vaccinations and half from infections. Long before we reach herd immunity, however, the infection and death rates will fall. Gu is projecting that by March infections will be half what they are now and by May about one-tenth the current rate. The drop will catch people by surprise just like the increase. We are not good at exponentials. The economy will boom in Q2 as infections decline.

If that sounds good bear in mind that 400,000 people are dead already and the CDC expects another 100,000 dead by February. We have a very limited window in the United States to make a big push on vaccines and we are failing. We are failing phenomenally badly.

To understand how bad we are failing compare with flu vaccinations. Every year the US gives out about 150 million flu vaccinations within the space of about 3 months or 1.6 million shots a day. Thus, we vaccinate for flu at more than twice the speed we are vaccinating for COVID! Yes, COVID vaccination has its own difficulties but this is an emergency with tens of thousands of lives at stake.

I would love it if we mobilized serious resources and vaccinated at Israel’s rate–30% of the population in a month. But if we simply vaccinated for COVID at the same rate as we do for flu we would save thousands of lives and hundreds of billions of dollars in GDP. The comparison with flu vaccinations also reminds us that we don’t necessarily need the National Guard or mass clinics in stadiums. Use the HMOs and the pharmacies!

Source: We Will Get to Herd Immunity in 2021…One Way or AnotherAlex Tabarrok @ The Marginal Revolution

With the new administration in power, let’s all hope that we win this war over this nasty virus. If a poor and communist China was able to crush it with no vaccines last year we should be able to crush it as well especially with the availability of multiple vaccines.

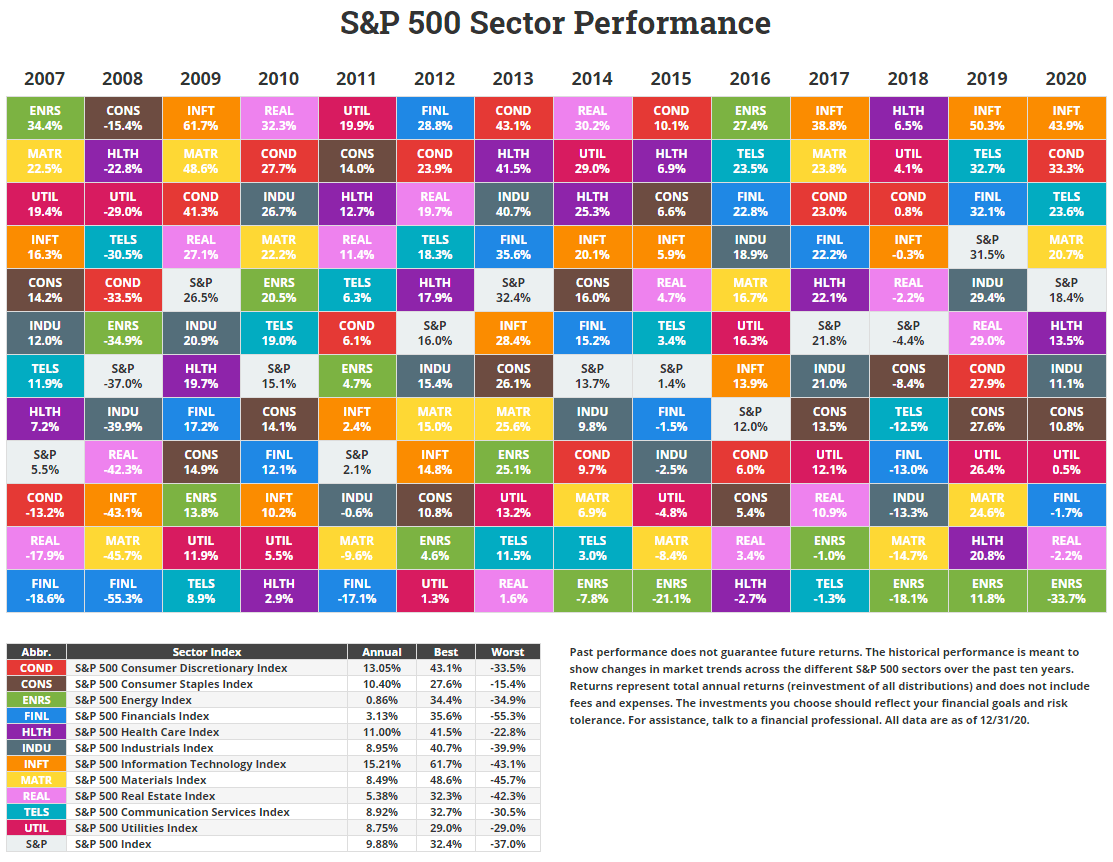
S&P 500 Sector Annual Total Returns 2007 To 2020: Chart

The historical annual returns of the various sectors in the S&P 500 index shows the performance of the sectors during different economic cycles. For instance, last year the IT sector was the best performer with a total return of 44% as the pandemic forced millions of Americans to depend on technology working from homes. In 2008, during the Global Financial Crisis the IT sector fell 43%.

The worst performing sector in 2019 was the energy sector was the energy industry got crushed when crude oil prices plunged and even went negative for a short time. The S&P 500 gained over 18% in total returns last year. This was on top of the 31% return the previous year.

Click to enlarge

Source: Novel Investor

Related ETFs:

  • SPDR S&P 500 ETF (SPY)
  • S&P MidCap 400 SPDR ETF (MDY)
  • SPDR Consumer Discretionary Select Sector SPDR Fund (XLY)
  • SPDR Consumer Staples Select Sector SPDR Fund (XLP)
  • SPDR Energy Select Sector SPDR Fund (XLE)
  • SPDR Financials Select Sector SPDR Fund (XLF)

Disclosure: No Positions

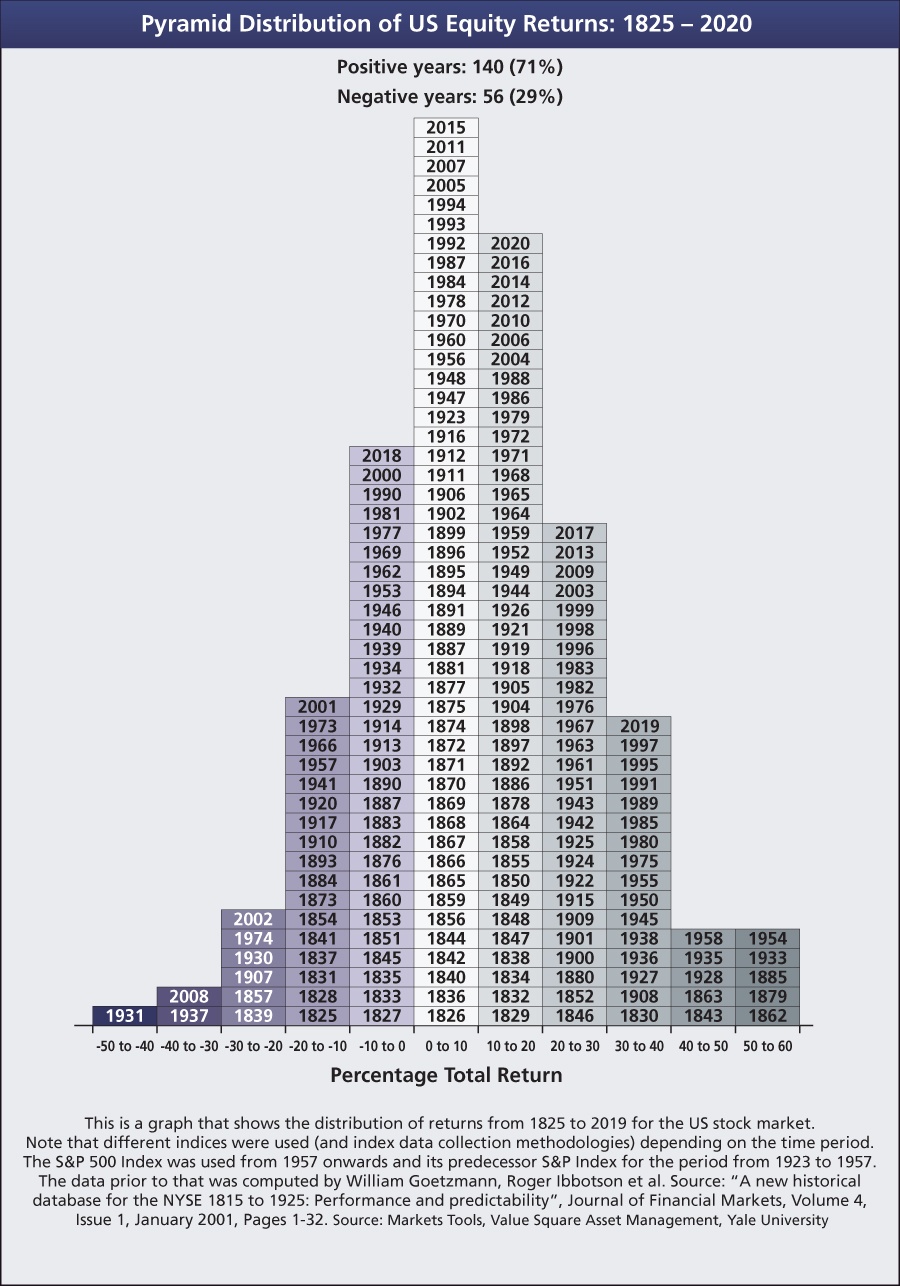
The Pyramid Distribution of S&P 500 Total Returns 1825 To 2020: Chart

The number of years stocks go up is higher than the number of year they go down over the long run. This theory is true for the US equity market also. The number of years the S&P 500 has yielded a positive return much higher than the other way around. The following chart shows the distribution of the returns for the S&P 500 from 1825 to 2020:

Click to enlarge

Source: Investment Office

The chart above shows the S&P 500 plunged 40 to 50% only once all the way back in 1931 at the height of the Great Depression. Similarly rise of over 40% in a year has been rare with just 10 years seeing such spectacular increases since 1825.

The key takeaway is that some years are great for stocks while others are not. So over a long period such as a decade or so it evens out leading to a decent return.

Related ETF:

  • SPDR S&P 500 ETF (SPY)

Disclosure: No Positions

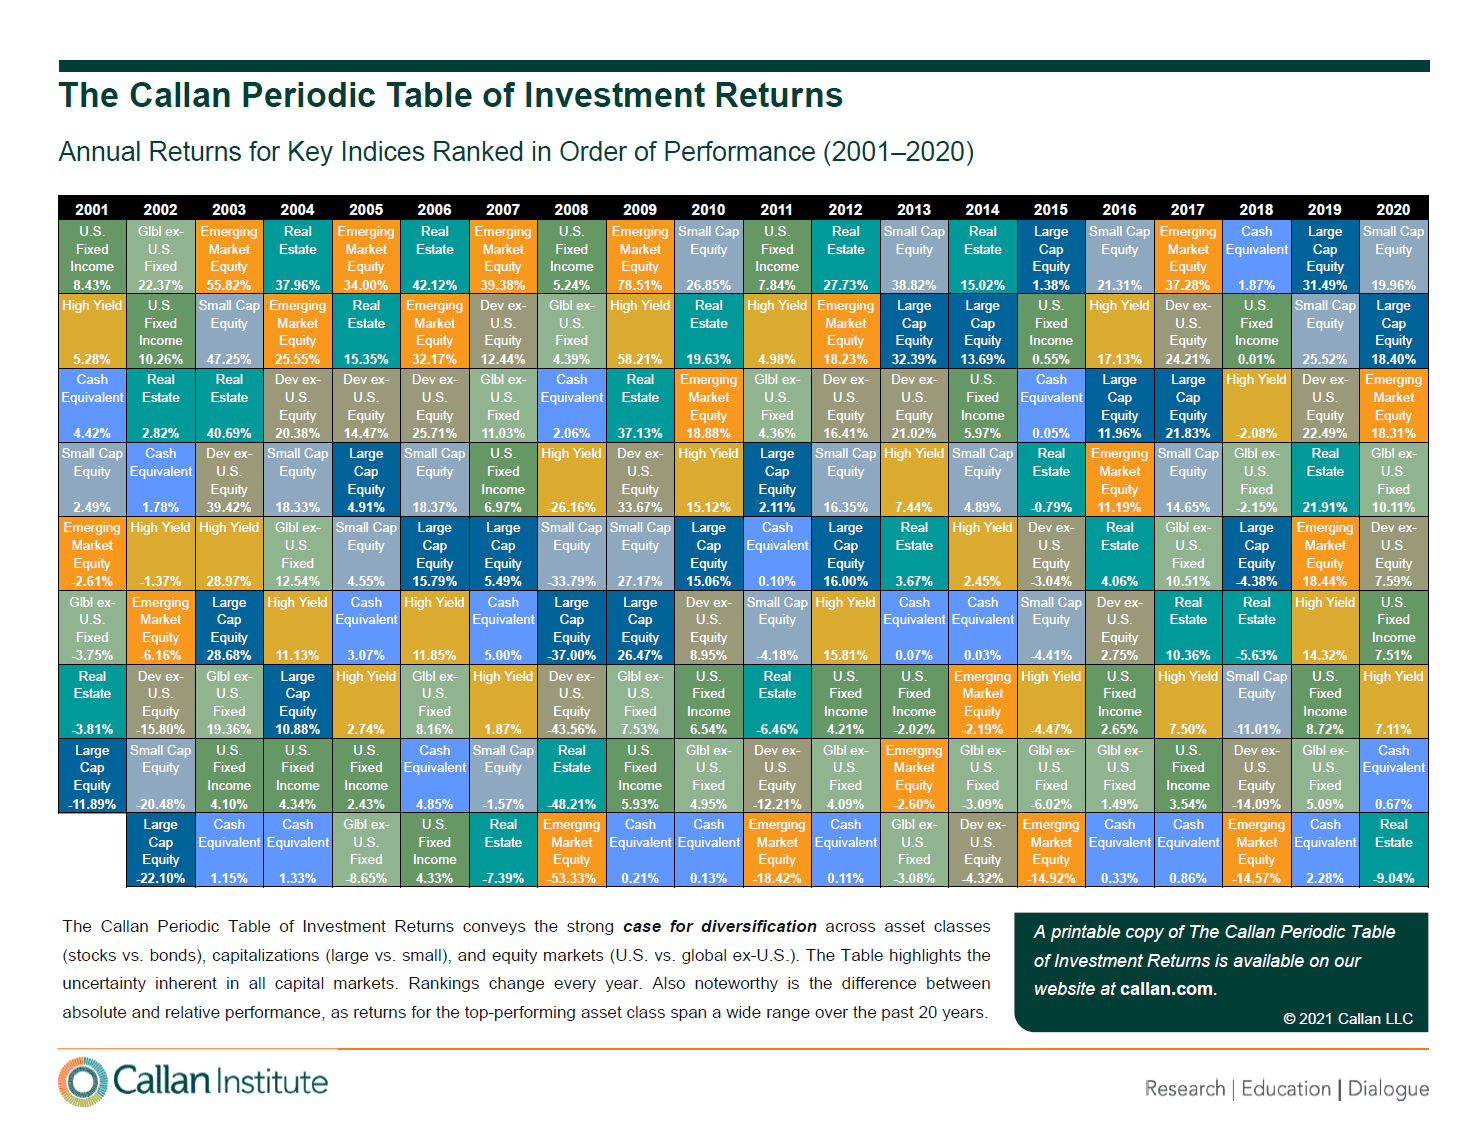
The Callan Periodic Table of Investment Returns 2001 To 2020

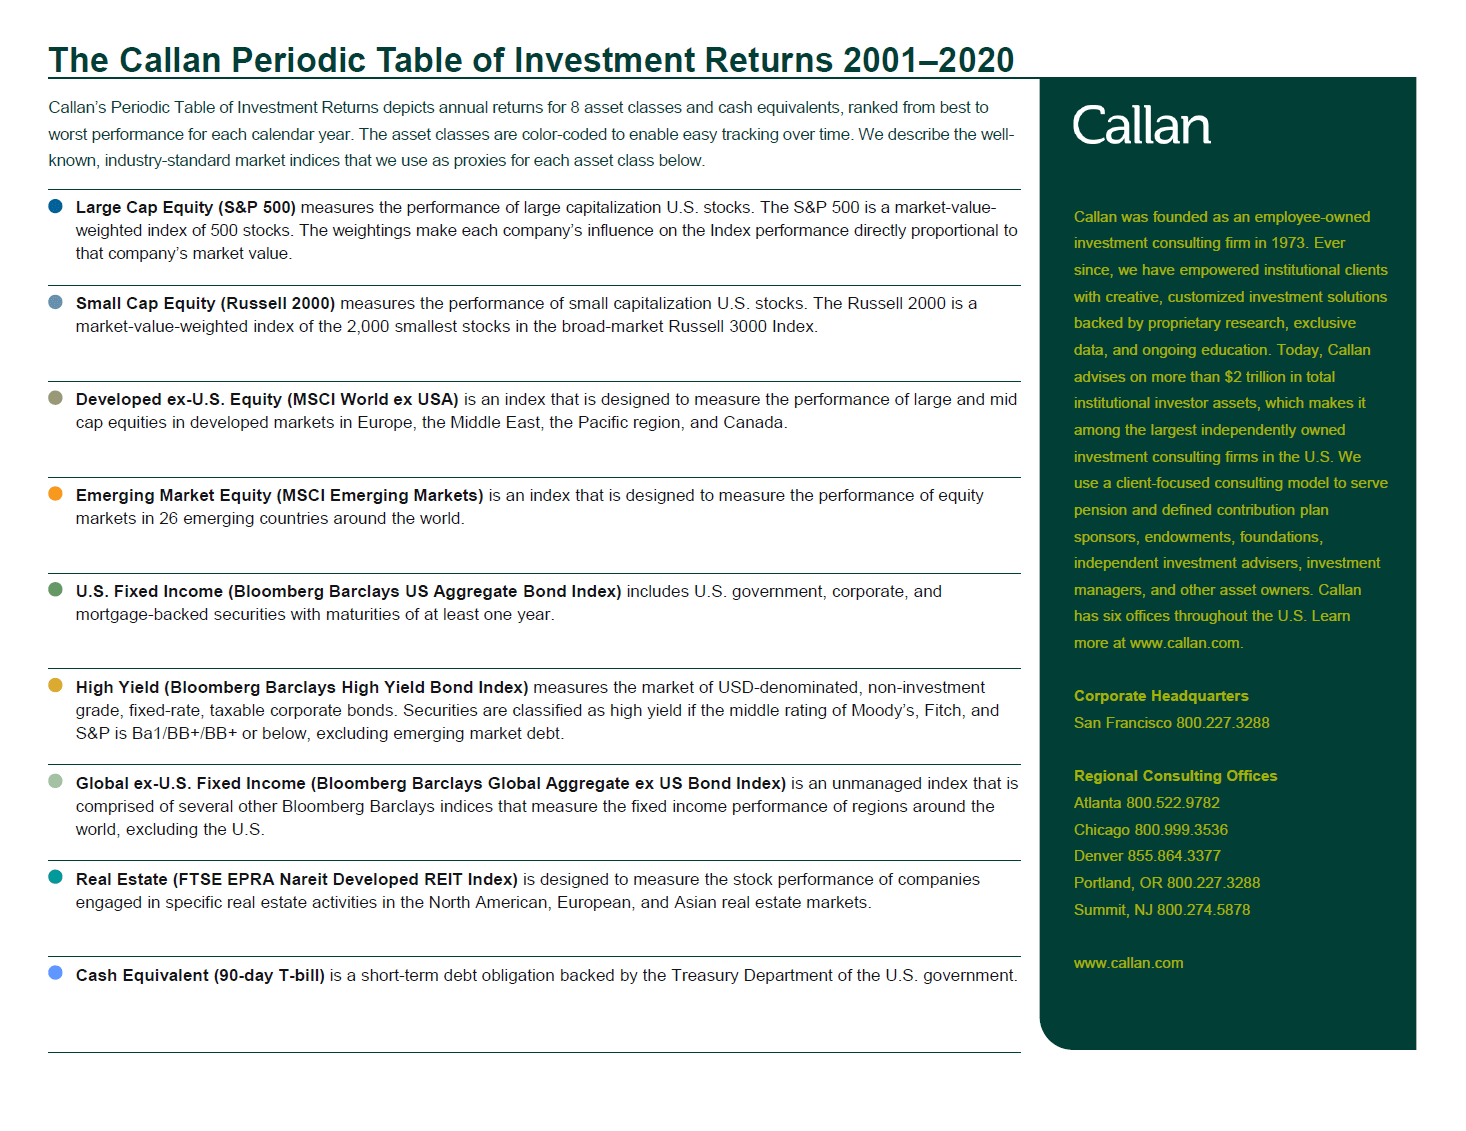
Callan has published their popular The Callan Periodic Table of Investment Returns with 2020 data. The importance of diversification is vividly illustrated by this excellent chart published year after year. Last year US Small Caps were the top performers with a return of about 20%. US large caps yielded just over 18%. The adverse effects of the pandemic devastated the real estate sector especially the commercial real estate side as workers fled offices. Hence Real Estate was down around 9%. Relative to the US market, emerging markets also performed well in 2020.

Update: The Callan Periodic Table of Investment Returns 2002 To 2021

Click to enlarge

Source: Callan Institute

Download in pdf format:

Key takeaway: Before 2020, Small Caps were the winners in 2016, 2013 and 2010 in the entire period from 2001 to 2020. Each year the best returns come from a different asset class. So the need for diversification cannot be under estimated.