The historical annual returns of the various sectors in the S&P 500 index shows the performance of the sectors during different economic cycles. For instance, last year the IT sector was the best performer with a total return of 44% as the pandemic forced millions of Americans to depend on technology working from homes. In 2008, during the Global Financial Crisis the IT sector fell 43%.
The worst performing sector in 2019 was the energy sector was the energy industry got crushed when crude oil prices plunged and even went negative for a short time. The S&P 500 gained over 18% in total returns last year. This was on top of the 31% return the previous year.
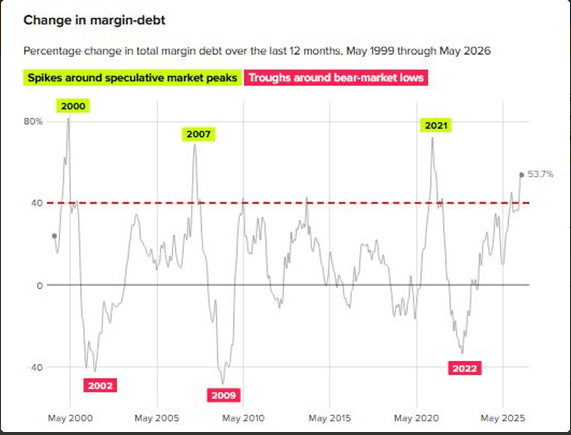
Click to enlarge
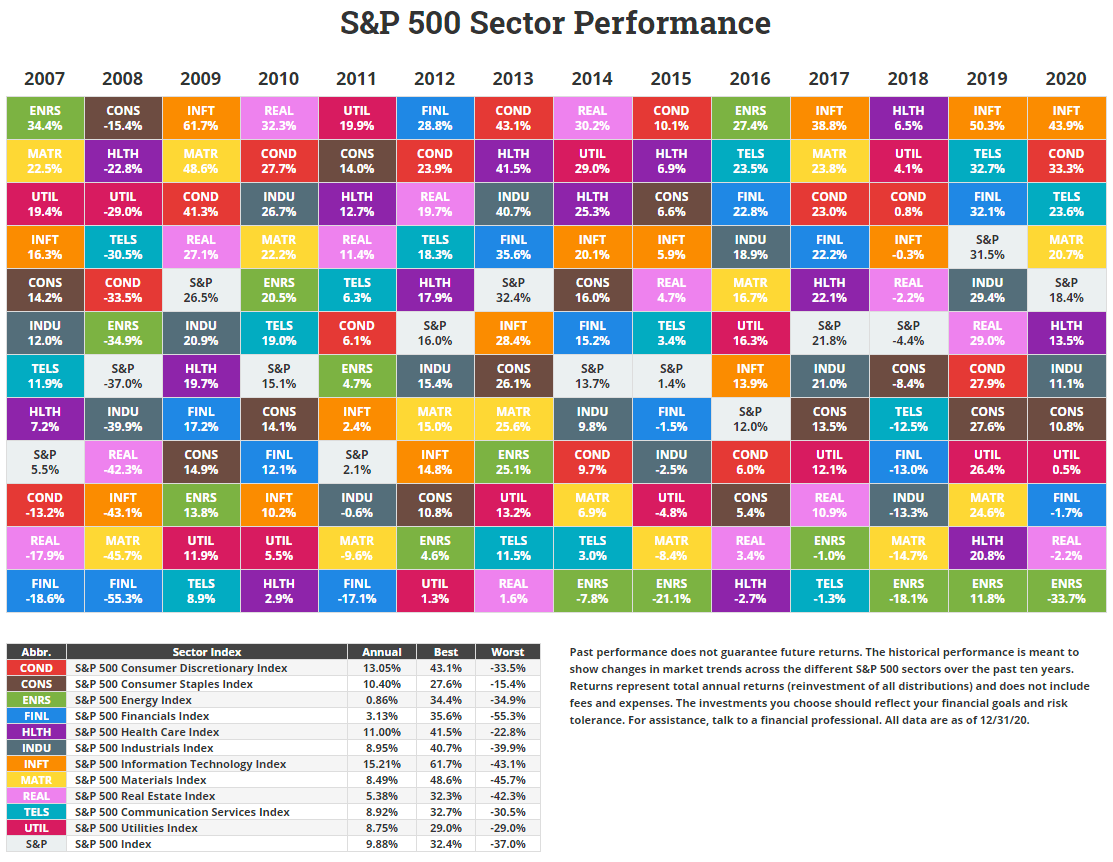
Source: Novel Investor
Related ETFs:
- SPDR S&P 500 ETF (SPY)
- S&P MidCap 400 SPDR ETF (MDY)
- SPDR Consumer Discretionary Select Sector SPDR Fund (XLY)
- SPDR Consumer Staples Select Sector SPDR Fund (XLP)
- SPDR Energy Select Sector SPDR Fund (XLE)
- SPDR Financials Select Sector SPDR Fund (XLF)
Disclosure: No Positions