Value Stocks Beat Growth Stocks Over The Long Term

One of the questions on many investors’ mind these days is this: Are Value Stocks Better Than Growth Stocks? Or is value investing dead? This is not surprising since 2020 has been the year for growth. Growth-oriented stocks in the tech, renewable energy, Electric Vehicle(EV), internet retail, etc. industries vastly out-performed value equities. Some of the winners from these industries that shot up substantially last year include Tesla(TSLA), Nio (NIO), Quantumscape Corp (QS), Amazon (AMZN), NVIDIA Corporation (NVDA), etc. The million dollar question is how long will these and other growth stocks will continue to rise. Of course, nobody knows the answer to this question. What do know is in the fight between value and growth, the winner is growth especially in the long run as measured in years or decades. A recent article by Matthew A. Young of Young Investments discussed this topic with supporting historical data. From the article:

Value-Oriented Strategies the Long-term Winner

Indeed, the latter point is undoubtedly true; but, unintuitively, over the long run, value-oriented stocks have performed best.

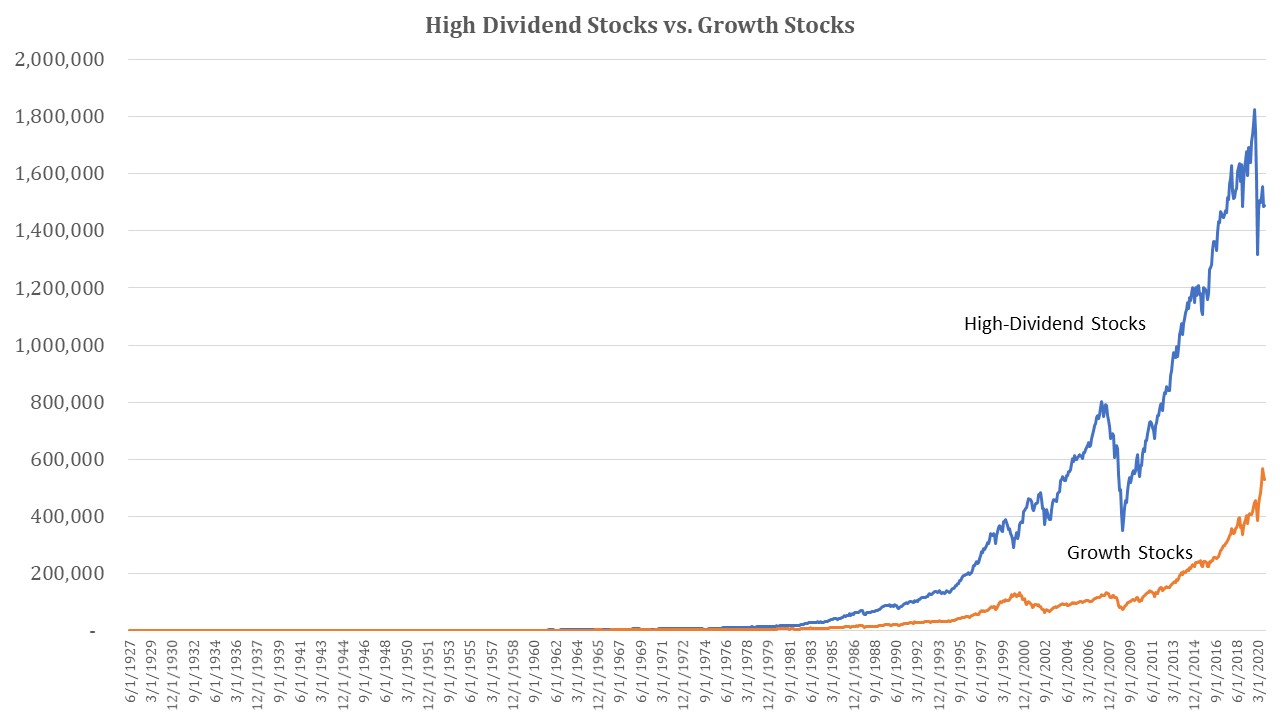
The chart below shows the long-term performance of $100 invested in high-dividend-yield stocks (value-oriented) versus $100 invested in growth stocks. The data comes from the Kenneth French Data Library. High-dividend stocks are measured by the top 30% of stocks ranked by yield and weighted by market value. Growth stocks are measured as the top 30% of stocks ranked by price to book (the most common metric to distinguish growth from value) and also weighted by market value.

As you can see in the chart, high-dividend stocks are the clear winner. Over the long run, it’s not even close. One hundred dollars invested in high-dividend stocks in June of 1927 is worth almost $1.5 million today. That same $100 invested in growth stocks is worth about $530,000 today.

The reason value-oriented shares outperformed growth shares is not because growth shares don’t have greater growth—they do. Value’s outperformance comes from a rebalancing effect. By example, you might buy a stock when the dividend yield is far above the market and sell that stock at a later date when the yield is far below the market. The same thing happens with growth stocks. A growth stock selling at a high price-to-book value may see growth slow, pushing it out of growth stock territory and resulting in growth funds selling the shares at a lower price.

According to Rob Arnott, chair of Research Affiliates and former editor of the Financial Analyst’s Journal, from 1963 through 2007 this rebalancing effect added 5.4% annually to value strategies and detracted 7% annually from growth strategies. The net effect was a 12.4% advantage for value shares. Since 2007, these figures are about the same. So even though growth stocks have greater growth in their fundamentals than value stocks, that growth differential isn’t enough to overcome the drag that growth strategies suffer from because of the rebalancing effect.
Source: No Easy Choices, Young Investments

The full piece is worth a read.

Key Takeaway: Growth stocks are great to own until the growth stops. So it is wise to not get carried away by spectacular returns and completely avoid value equities. The ideal solution is to diversify among various assets classes such as value, growth, domestic, foreign, real estate, gold, etc.

Disclosure: No Positions
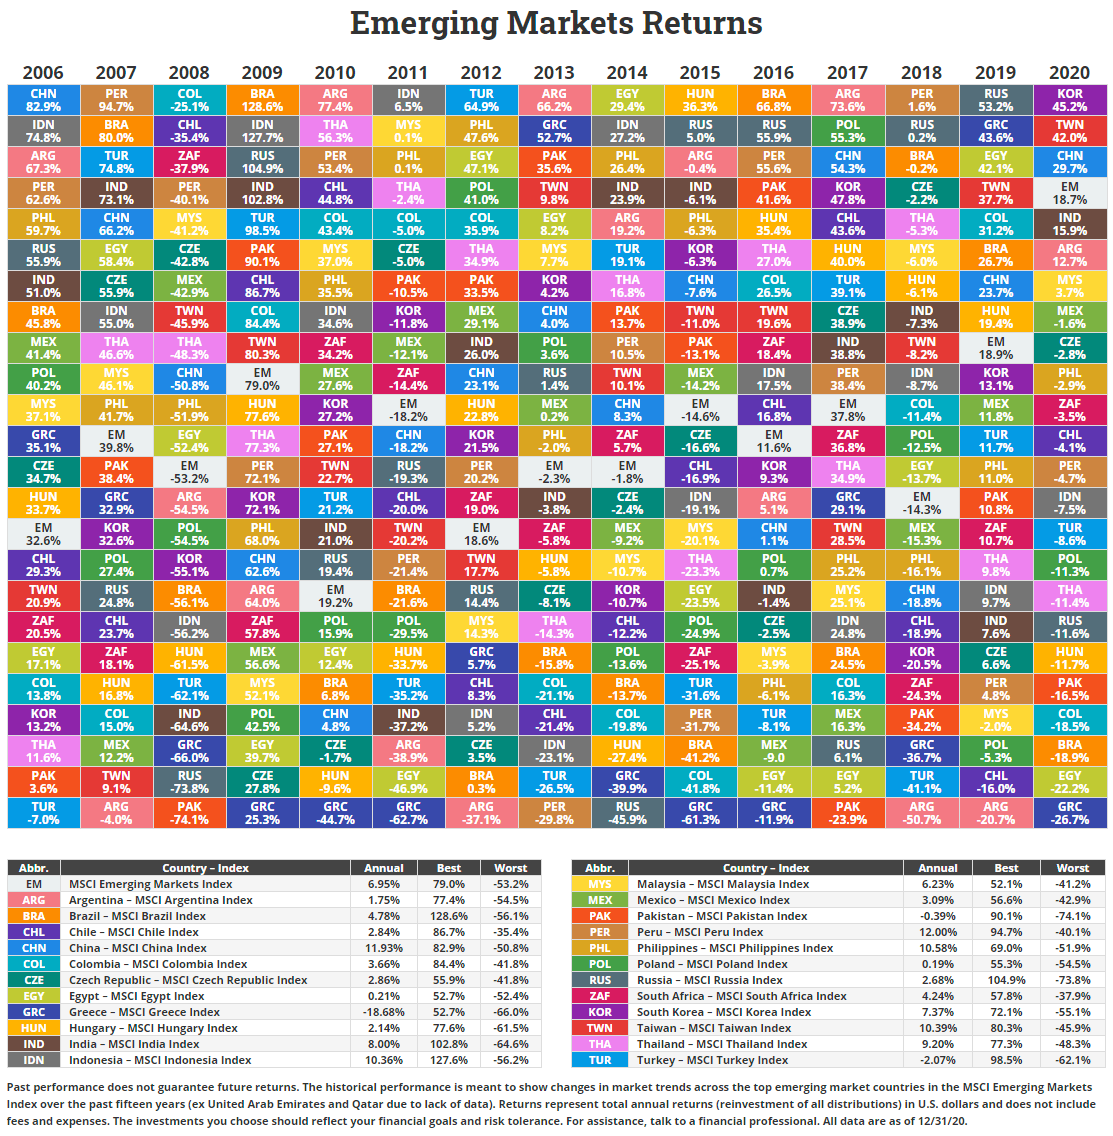
Emerging Market Country Returns By Year From 2006 To 2020: Chart

We looked at the Developed Market Country Returns chart yesterday. In this post, let’s review the Emerging Market Country Returns chart for the period 2006 – 2020:

Click to enlarge

Note: Returns shown above are based on the respective MSCI index returns in US Dollar terms.

Source: Novel Investor

South Korea was the top performer in 2020 with a return of over 45%. The boom in the tech sector particularly the chip industry boosted the Korean market.  The next best returns came from Taiwan, another country with a leadership position in chip and tech manufacturing. Despite highly dependent on commodity prices especially crude oil, the Russia market lost just over 11% as crude recovered strongly later in the year.

Related ETFs:

  • Market Vectors Russia ETF (RSX)
  • iShares MSCI Mexico Capped Investable Market (EWW)
  • iShares FTSE/Xinhua China 25 Index (FXI)
  • iShares MSCI South Korea ETF (EWY)
  • iShares MSCI Turkey ETF (TUR)
  • iShares MSCI Taiwan ETF (EWT)
  • The iShares MSCI India ETF  (INDA)

Disclosure: No Positions

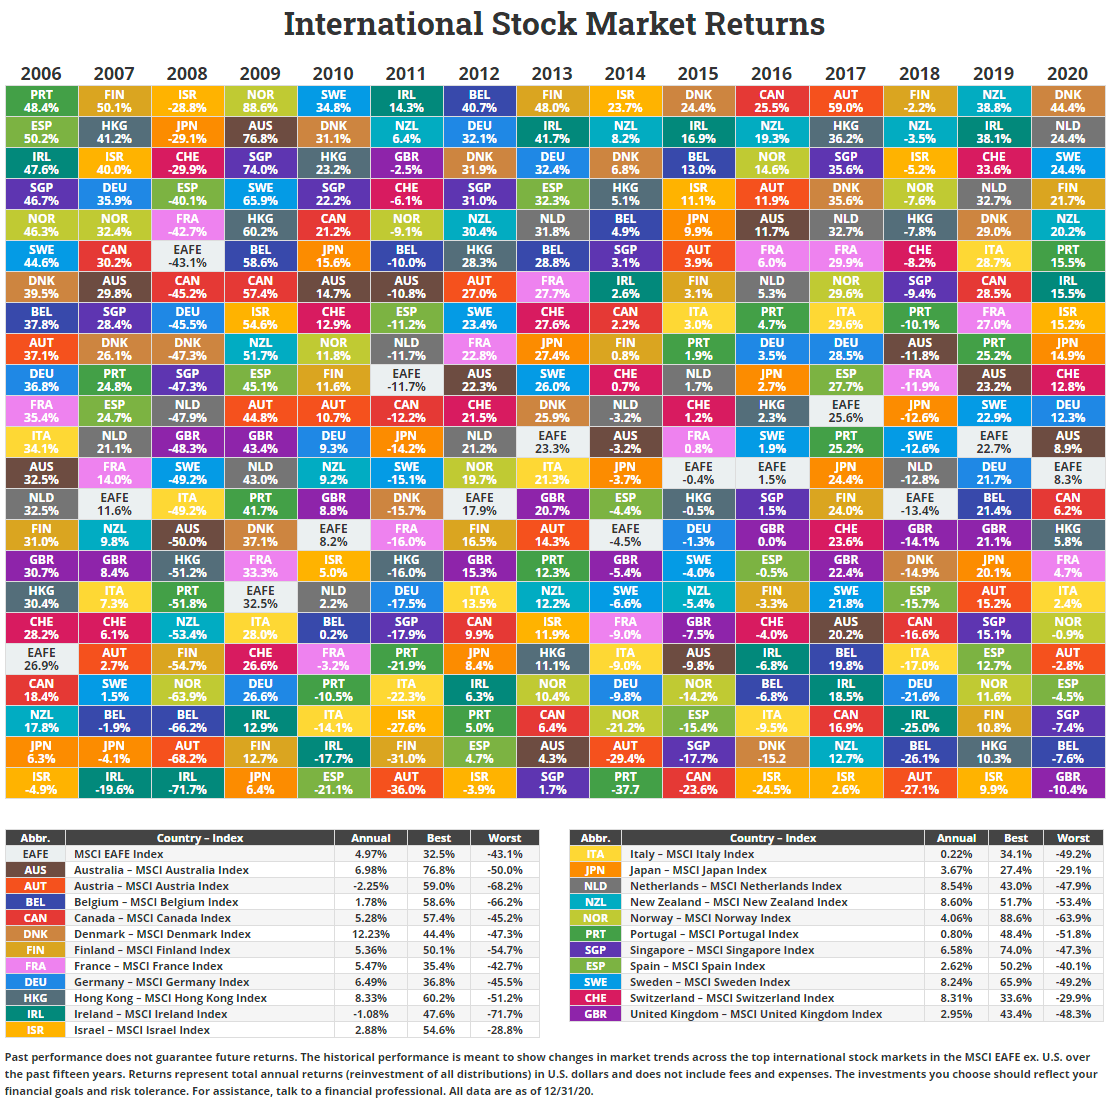
International Stock Market Returns 2006 To 2020: Chart

The International Stock Market Returns chart was recently updated with data for 2020 by Novel Investor. The chart shows the returns of the major developed market indices based on the respective MSCI index returns in US Dollar terms.

Click to enlarge

Source: Novel Investor

Note: An interactive version of the chart can be found in the above link

The best performing market in 2020 was Denmark with a return about 45%. The Danish market was one of the best markets in the world since the index is heavily concentrated in healthcare and green energy industries. About half of the benchmark index is healthcare with companies like Novo Nordisk(NVO) and Coloplast(CLPBY). Green energy giant Orsted (DNNGY) is also represented in the benchmark and MSCI indices.

UK was the worst performing market with a loss of over 10% due to declines in energy and banking stocks and also the Brexit saga.

The chart also shows the importance of diversification as no market is the best year after year.

Disclosure: No Positions

Say Hi to Stellantis, the New Global Auto Leader

Welcome to Stellantis, the newly created Auto company formed by the merger of Peugeot S.A. and Fiat Chrysler Automobiles N.V. Stellantis will trade on the NYSE from Tuesday (1/19/21) under the ticket STLA. This ticker should not be confused with the ticker TSLA which is for another well-known automaker Tesla. Of course, Tesla’s production output is nowhere near Stellantis, which is the fourth-largest automaker in the world. Stellantis will haver annual sales of about 8.1 million vehicles.

The name Stellantis sounds like a name of a new drug. Drug companies in the US are known for coming up with all kinds of weird names for their over-priced drugs with names like Symbicort, Neulasta, Abilify, Keytruda, Otezla, etc. While this strategy  works for drug companies, it remains to be seen if consumers feel comfortable to buy a Stellantis car or even used the word when talking about cars.

Below is a brief excerpt from an article in WSJ:

Fiat Chrysler FCAU -4.93% Automobiles NV and Peugeot-maker PSA Group PUGOY -5.70% cemented their trans-Atlantic merger Saturday, creating Stellantis NV, a global auto-making giant that executives say will have the heft needed to compete in a fast-changing industry.

The deal, first agreed to in late 2019 and approved earlier this month by shareholders, comes as the global car business is rapidly shifting to new technologies, such as electric vehicles, and battling upstarts trying to upend everything from the way cars are engineered and built to how they are sold.

Stellantis, derived from Latin term meaning “to brighten with stars,” ranks as the world’s third-largest auto maker by sales, according to 2019 figures, the latest available. At Friday’s close, it was worth more than $51 billion. The newly formed car company plans to start trading under the ticker symbol STLA on the Paris and Milan stock exchanges Monday and in New York on Tuesday.

Stellantis will have a major presence in North America and more than a quarter of the market in Europe, selling vehicles through a massive collection of brands, ranging from American names like Jeep and Ram to Peugeot, Citroën and Opel in Europe and Maserati and Alfa Romeo on the luxury end.

Source: Fiat Chrysler, PSA Group Merge to Create New Auto-Making Behemoth, WSJ

With a collection of a so many well-established brands it would be interesting to watch if this new company is successful.

Disclosure: No Positions

Related lists:

What If You Only Invested at Market Peaks?: Video

US equity markets are at record levels. Lately there have been many articles in the media discussing if the market has reached its peak and a crash is on the horizon soon. With stocks at peak some investors may be wondering what if I invest now and market crashes soon after. Recently I cam e across an excellent video posted by Ben Carlson of A Wealth of Common Sense blog that explained how an unlucky investor invested at market tops and still came out ahead. You can checkout that video below:


Source: What if You Only Invested at Market Peaks? by Ben Carlson via The Big Picture

While Ben’s video is about US stocks, a blogger at Rankia expanded the idea and calculated the returns for major global markets. You can find that article here (in Spanish – So use Google Translate)

Related: