Financial Transaction Tax Rates in Europe 2021: Chart

Investing in many European equities involve a tax called Financial Transaction Tax (FTT). This tax was implemented in some countries in Europe after the Financial crisis of 2008-09. In the basic sense, FTT is a levy or duty charged just for the privilege of transacting in certain financial securities including stocks.

The following chart shows which countries apply the Financial Transaction Tax for 2021:

Click to enlarge
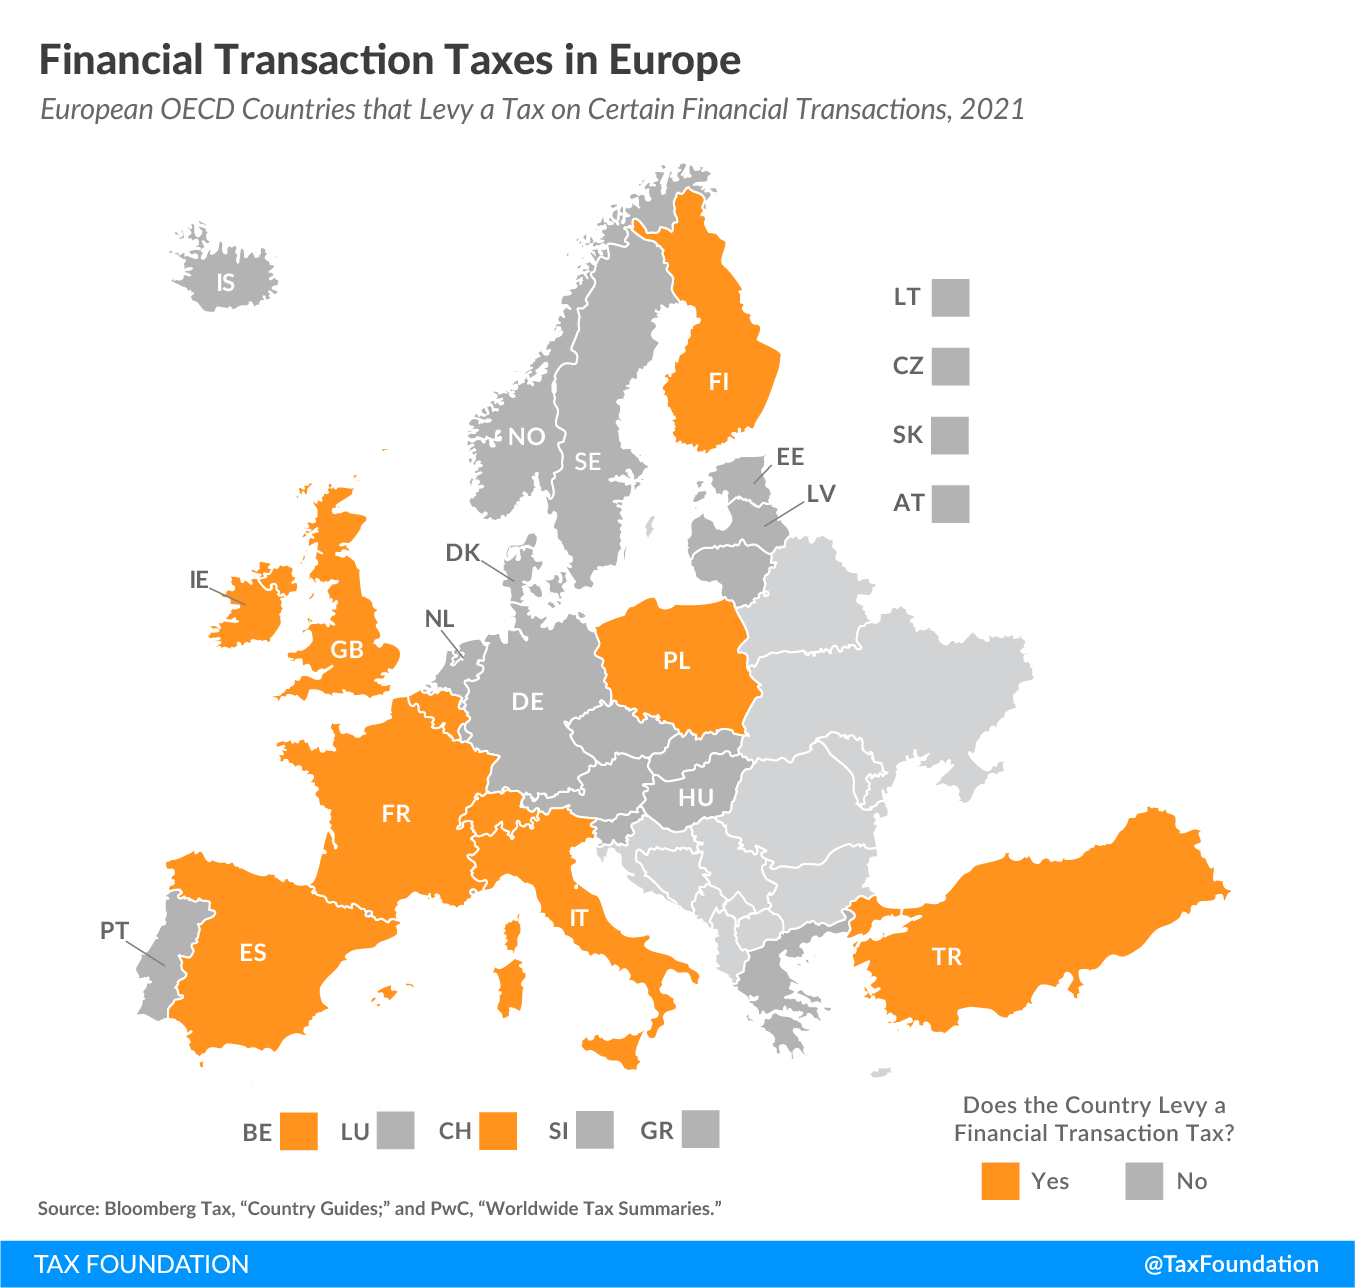
The FTT rate varies widely across countries. The latest rate is shown in the following table:

Country Tax Rate
Belgium (BE) 0.12% – 1.32%
Finland (FI) 1.6% – 2.0%
France (FR) 0.01% – 0.30%
Ireland (IE) 1%
Italy (IT) 0.02% – 0.20%
Poland (PL) 1%
Spain (ES) 0.20%
Switzerland (CH) 0.15% – 0.30%
Turkey (TR) 0.0% – 1.0%
United Kingdom (GB) 0.5% – 1.5%
Sources: Bloomberg Tax, “Country Guides,” https://www.bloomberglaw.com/product/tax/toc_view_menu/3380; and PwC, “Worldwide Tax Summaries,” https://taxsummaries.pwc.com/.

Source: Financial Transaction Taxes in Europe by Elke Asen, Tax Foundation

Obviously the introduction of FTT has made European stocks unattractive to American investors. In addition to FTT, US investors in ADRs pay additional charges like a Dividend Withholding Tax and an ADR fee, if applicable as well.

Let’s take an example of French auto parts maker Valeo(VLEEY). An investor buying 100 shares would pay the following FTT:

VLEEY price on 2/19/21 = $19.48

For 100 shares = $1,948.00

FTT at 0.30% for $1,948 = $5.85

The FTT amount would be charged at the time of both buying and selling. Assuming the investor sells at the same $19.48 price, would pay a second FTT of $5.85. Because the FTT is a percentage and not a fixed amount, of course if the investor sells at a higher share price, he/she would pay a higher FTT as well.

On top of this, any dividends paid out will be reduced by 26.5% for dividend withholding taxes. Finally the ADR fee of $0.02 per ADR would be charged annually. So that would be $2.00. Usually this amount is deducted from the dividend paid to make it easier for investors. If a company does not pay a dividend, then it will be taken from the cash portion of an account.

Of course if the stock goes to $0, one would lose not only the original investment but also ends paying the FTT for nothing. This benefits the French government as some kind of free money donated by unknown nameless strangers from a foreign land.

The recent GameStop saga has some calling for the introduction of the FTT by the US. However it is unlikely to gain traction in the US.

Disclosure: Long VLEEY
Gold Price vs. Dow Jones Industrial Average – 100, 30 and 10 Year Return Charts

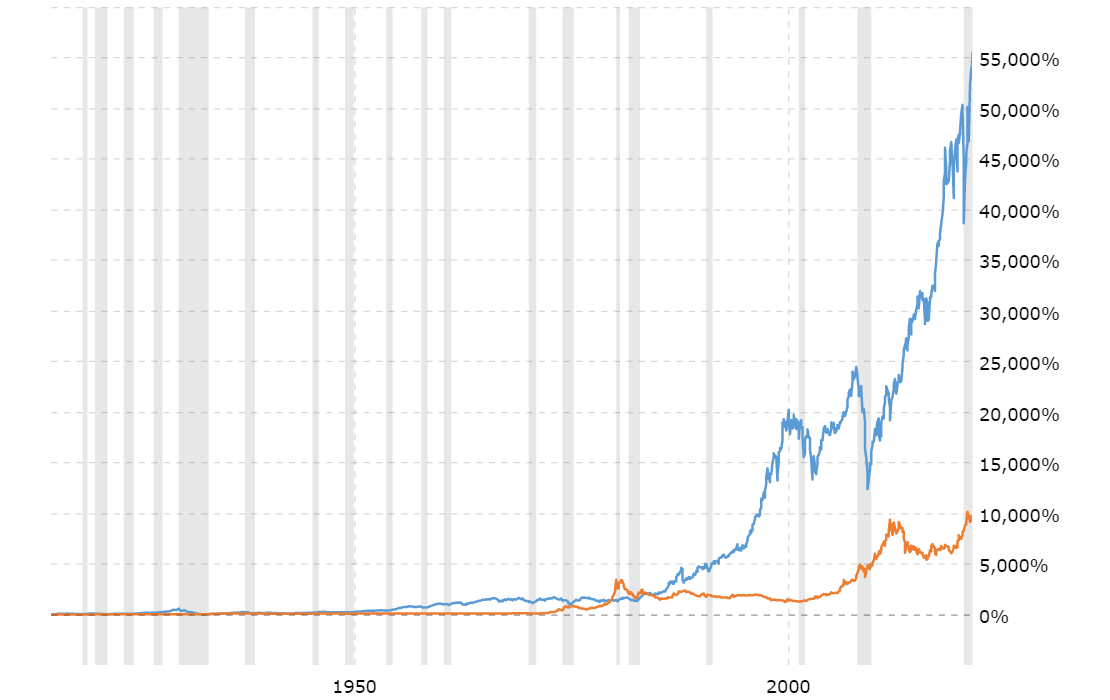
Equities beat gold in the short and long-terms. As an asset class gold is important to hold in a well-diversified portfolio. However gold returns lag stocks when returns are measured in many years such as 100, 30 and 10 years. This is because stocks are still the preferred asset for growing wealth. In this post, let’s take a quick at the performance of gold over US stocks are represented by the Dow Jones Industrial Average.

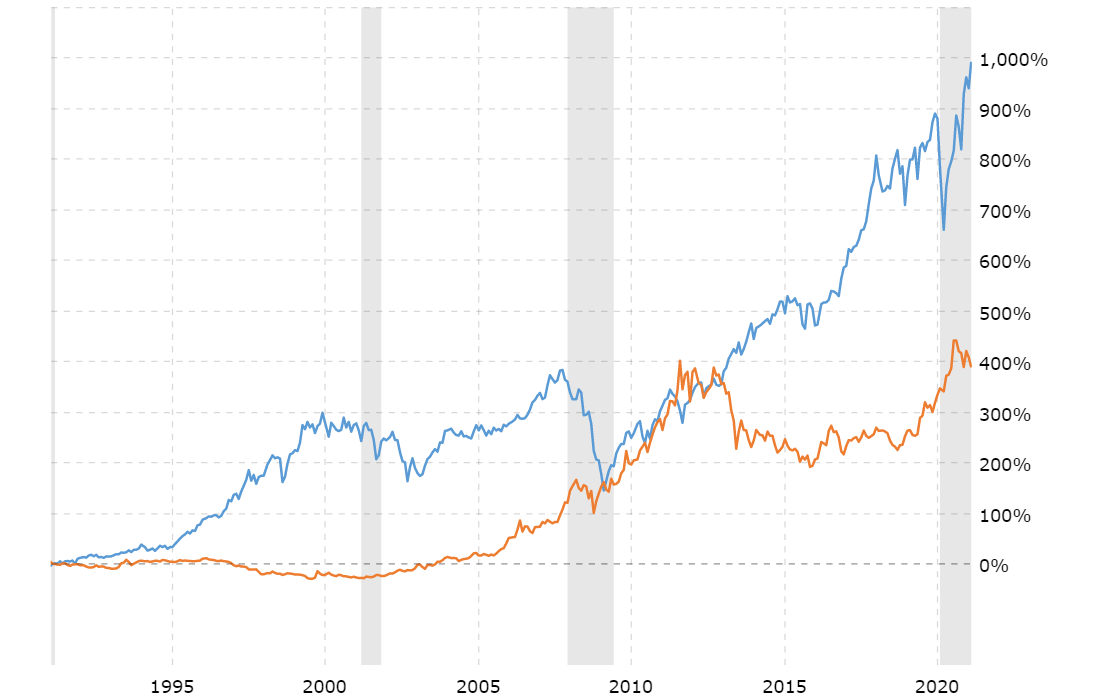
1.Gold Price vs. Dow Jones Industrial Average – 100 Year Return:

Through the end of Jan, 2021 gold returned around 9,500% while Dow Jones return exceeded 52,000% over the last 100 years.

Click to enlarge

2.Gold Price vs. Dow Jones Industrial Average – 30 Year Return:

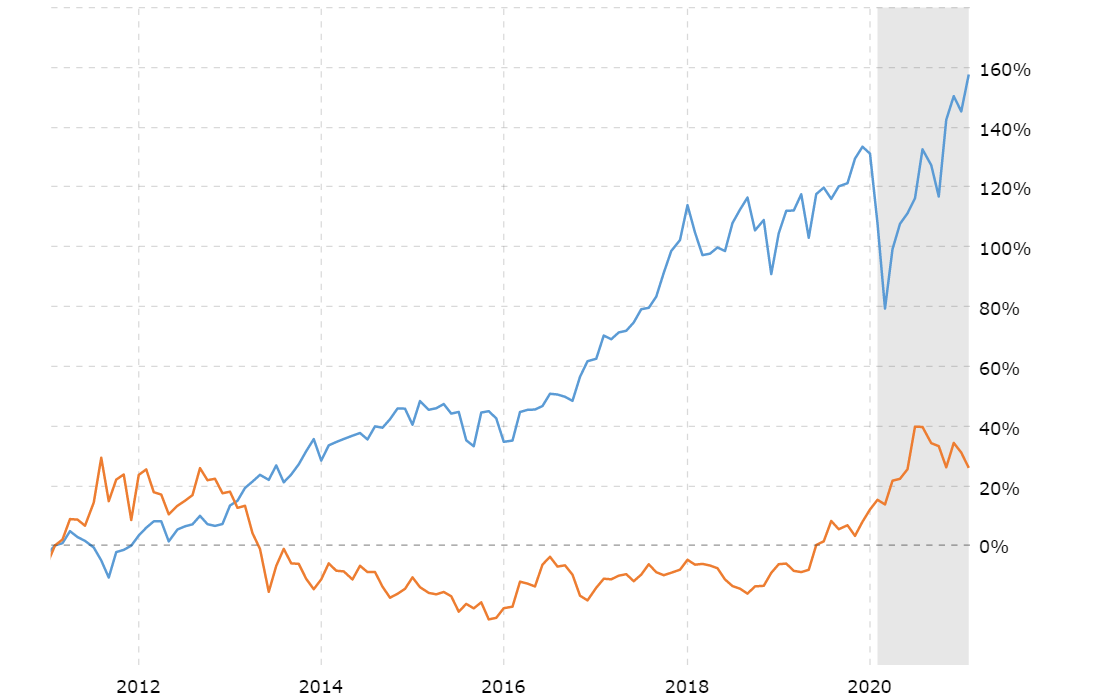
3.Gold Price vs. Dow Jones Industrial Average – 10 Year Return:

Over the past 10 years, Dow has grown 158%. But gold increased by just 26%.

Notes:

1.Blue is Dow Jones and Orange is gold returns

2.Shaded lines represent recessions

Source: MacroTrends

Related ETFs:

  • SPDR Gold Trust ETF (GLD)
  • SPDR Dow Jones Industrial Average ETF (DIA)

Disclosure: No Positions

Which Chinese Companies are Global Industry Leaders?

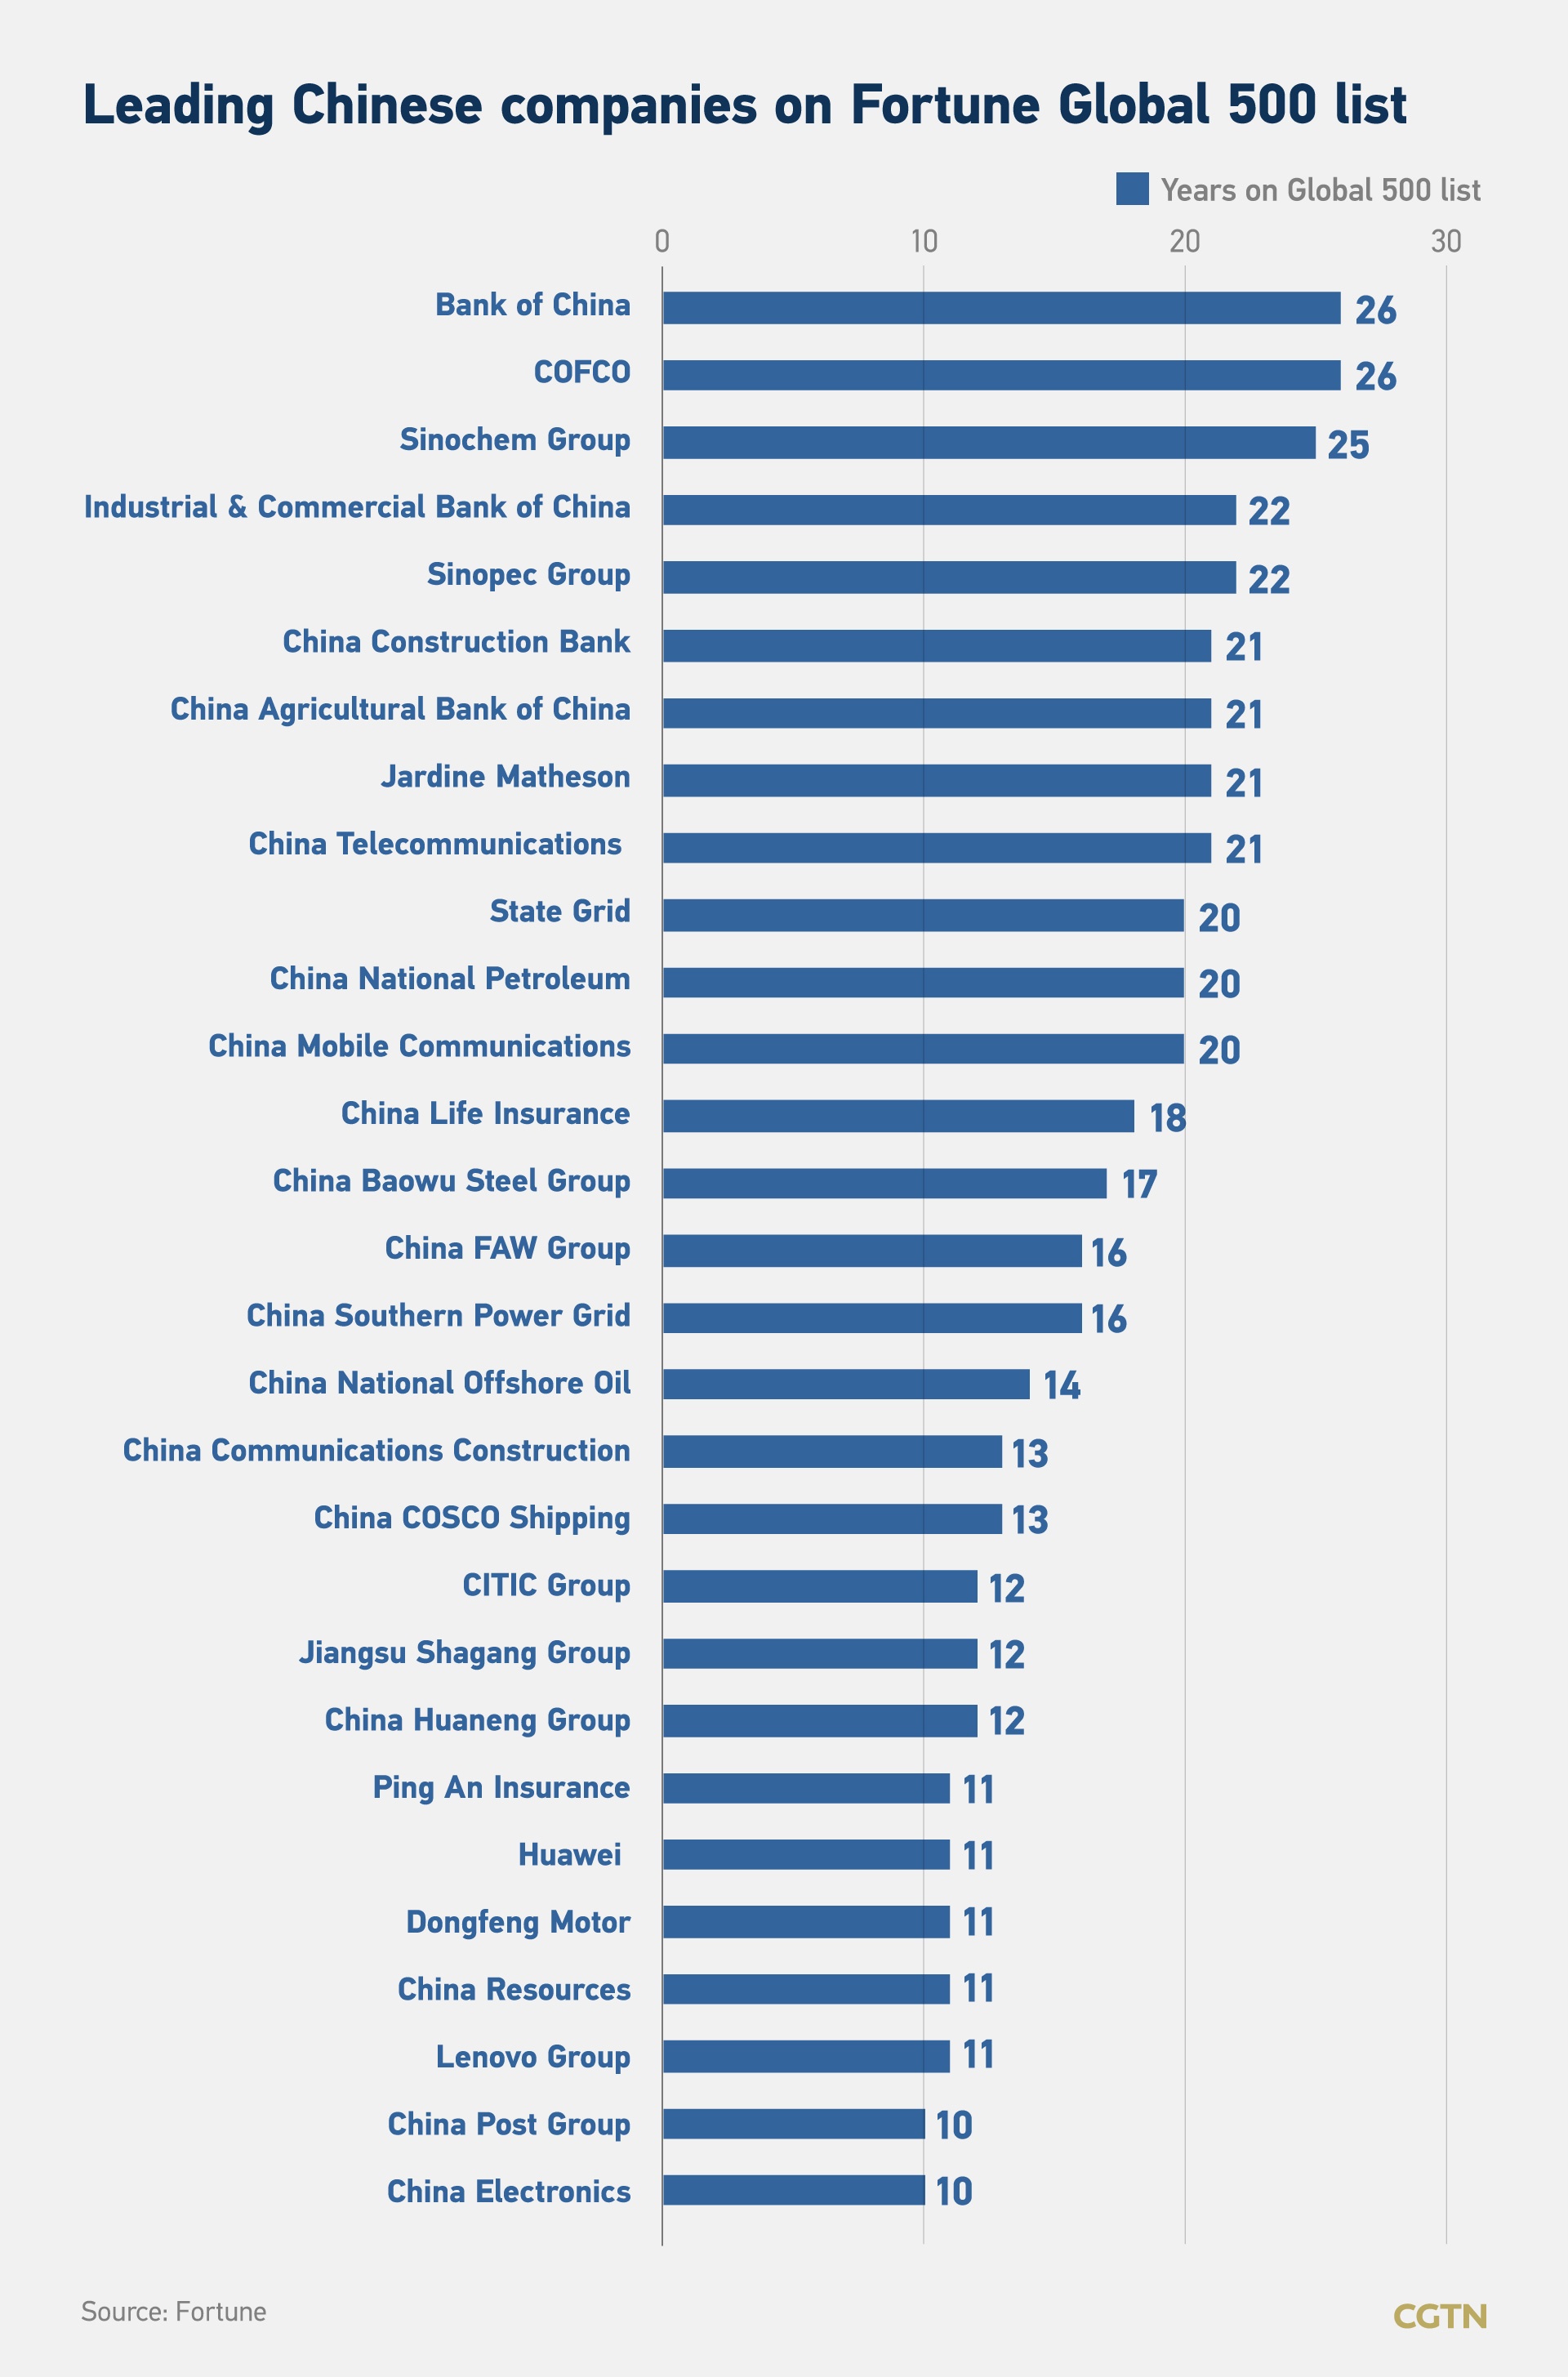
Chinese companies are increasingly competing and growing at a global level. As China’s economy grew relatively better than other countries last year, companies from China dominated the Fortune Global 500 list for 2020 overtaking the US. To put this feat in perspective, in the 1990 list there were no Chinese companies in the list.  Sinopec, State Grid and China National Petroleum were in the top 10. The annual Fortune Global 500 is compiled based on revenue.

The following top Chinese firms were in the 2020 Fortune Global 500 list:

Click to enlarge


It is not just more Chinese firms are in this global ranking. Companies from China are also taking the leadership positions in many industries engineering and construction, petroleum refining, shipping, etc. as shown in the graphic below:

Source: Charts: A breakdown of Chinese companies ranked on Fortune Global 500, CGTN

Related:

Disclosure: No positions

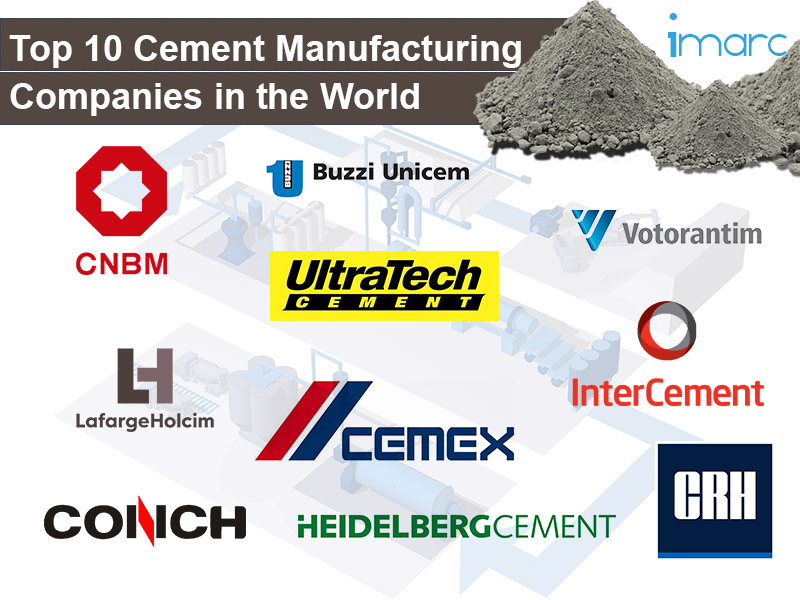
The Top 10 Cement Manufacturing Companies in the World

The Top 10 Cement Manufacturing Companies in the World based on 2019 volume are shown in the graphic below:

Click to enlarge

Source: IMARC

The companies above are listed below with their tickers, if available:

  1. China National Building Material Co., Ltd. (CNBM)
  2. LafargeHolcim Ltd. (HCMLY)
  3. Anhui Conch Cement Co., Ltd.
  4. Heidelberg Cement AG (HDELY)
  5. CEMEX S.A.B. de C.V (CX)
  6. UltraTech Cement Ltd.
  7. Votorantim Participações S. A.
  8. InterCement Brasil S.A.
  9. CRH PLC (CRH)
  10. Buzzi Unicem USA, Inc.

Related:

Disclosure: No Positions

Contribution of Price Appreciation and Dividends to the S&P 500 Total Return by Decade

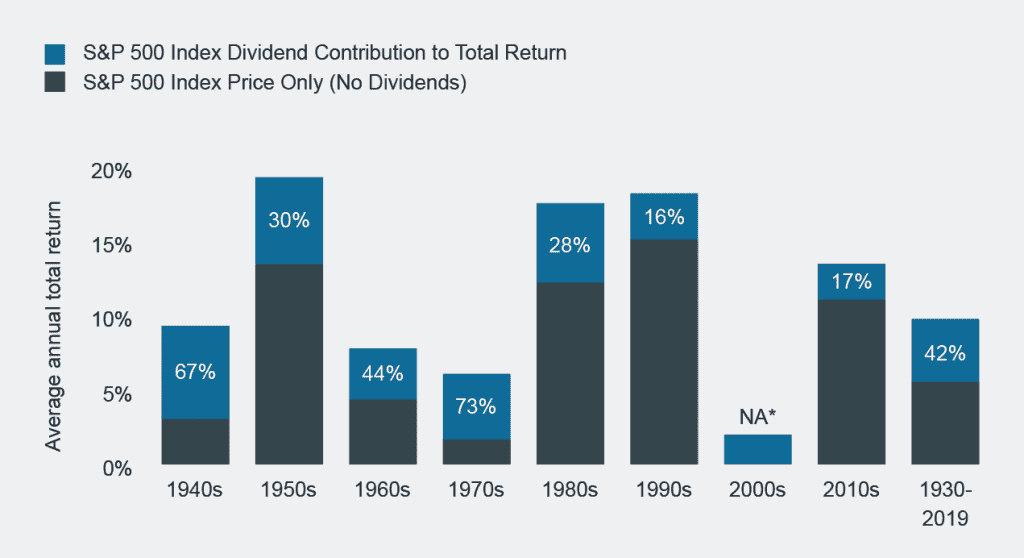
Investing in dividend stocks is a wise strategy for many reasons including the fact that dividends alone account for one-third of the S&P 500’s Total Return from 1960 to 2019. So though the dividend yield is small for most US stocks relative to other developed markets they are still important from a long-term wealth building perspective. I came across an interesting study titled “The Importance of Dividends to Total Returns“. by Job Curtis and Neil Hermon at Janus Henderson. Below is an excerpt from the research:

The contribution of dividends to total returns fluctuates over time of course. The analysis below of the widely-followed US large cap barometer, the Standard & Poors 500 Index (S&P 500) from 1930 to 2019, conducted by US-based asset manager Hartford Funds, shows that for the period as a whole, the divided contribution averaged 42% which equates to 1.8% per annum on an annualised basis. Looking at the decades discretely, however, illustrates the extent to which that contribution to total return varies.

Contribution of Dividends and Price Appreciation to S&P 500 Total Returns by Decade

Source: Morningstar/Hartford Funds, 02/2020. S&P 500 Index is a market capitalisation weighted price index composed of 500 widely held shares. *Total return for the S&P 500 Index was negative for the 2000s. Dividends provided a 1.8% annualised return over the decade.

During the 1940s, ’60s and ’70s – decades in which total returns were lower than 10% – dividends played a significant role in terms of their contribution, but played a smaller role during the 1950s, ’80s and ’90s when total returns were well into double figures.

During the 1990s, dividends were de-emphasised as companies chose to deploy capital by reinvesting into their businesses rather than by returning it to shareholders. From 2000 to 2009, a period commonly referred to as ‘the lost decade’[3], the S&P 500 delivered a negative return, primarily a consequence of the bursting of the dotcom bubble in March 2000.

[3] Source: S&P 500 Index

Source: The Importance of Dividends to Total Returns, Janus Henderson

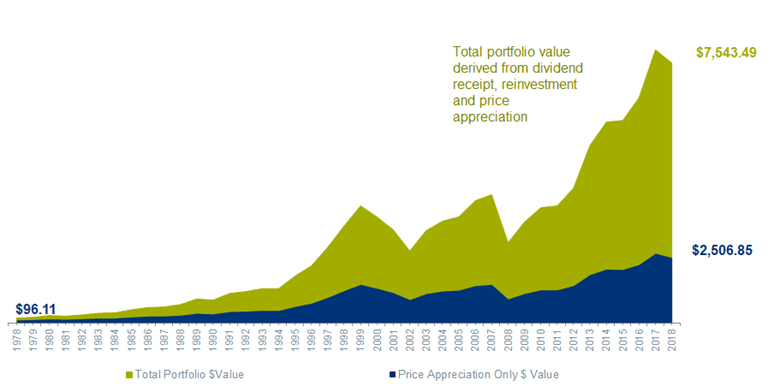
The following is a neat illustration of the above topic for a hypothetical investment from 1978 to 2018:

Click to enlarge

Source: Merits of Dividends, ThomasPartners

From the above article:

To total returns over time.

The ability to reinvest dividends has had a significant impact on an investor’s ability to create wealth in the stock market.

For example, if an investor had purchased one theoretical share of the S&P500 index on December 31, 1978, it would have cost them about $96.11. 40 years later, on December 31, 2018, that one share of the S&P500 would have appreciated to nearly $2,506.85 If the investor had been able to reinvest those dividends in the index, their investment would have grown to over $7,500.

Investors interested in adding dividend payers to their portfolios can consider the below stocks for further research:

1.Company: Exelon Corporation (EXC)
Current Dividend Yield: 3.62%
Industry: Electric Utilities

2.Company: Royal Bank of Canada (RY)
Current Dividend Yield: 4.06%
Sector: Banking

3.Company: Union Pacific Corp (UNP)
Current Dividend Yield: 1.82%
Sector: Railroads

4.Company: Kimberly-Clark Corp (KMB)
Current Dividend Yield: 3.45%
Sector: Household Products

5.Company: Bancolombia SA . (CIB)
Current Dividend Yield: 4.17%
Sector: Banking

6.Company:Colgate-Palmolive Co (CL)
Current Dividend Yield: 2.24%
Sector: Household Products

7.Company: Enbridge Inc (ENB)
Current Dividend Yield: 7.61%
Sector: Oil & Gas Transportation

8.Company: National Grid PLC (NGG)
Current Dividend Yield: 5.30%
Sector: Multi-Utilities

9.Company: Duke Energy Corp (DUK)
Current Dividend Yield: 4.30%
Industry: Electric Utilities

10.Company: The Hershey Company (HSY)
Current Dividend Yield: 2.12%
Industry: Food Products

Dividend Withholding Tax: RY, CIB, ENB, NGG are foreign stocks. Hence the dividend withholding taxes may reduce the yield quoted above. The applicable rate can be found here. On top of this, ADR fees may also be applied.

Note: Dividend yields noted above are as of Feb 16, 2021. Data is known to be accurate from sources used. Please use your own due diligence before making any investment decisions.

Disclosure: Long UNP and RY

Related ETFs:

  • SPDR S&P 500 ETF Trust (SPY)
  • iShares Select Dividend ETF (DVY)
  • Vanguard High Dividend Yield ETF (VYM)
  • Vanguard Dividend Appreciation ETF (VIG)

Disclosure: No Positions