Equities beat gold in the short and long-terms. As an asset class gold is important to hold in a well-diversified portfolio. However gold returns lag stocks when returns are measured in many years such as 100, 30 and 10 years. This is because stocks are still the preferred asset for growing wealth. In this post, let’s take a quick at the performance of gold over US stocks are represented by the Dow Jones Industrial Average.
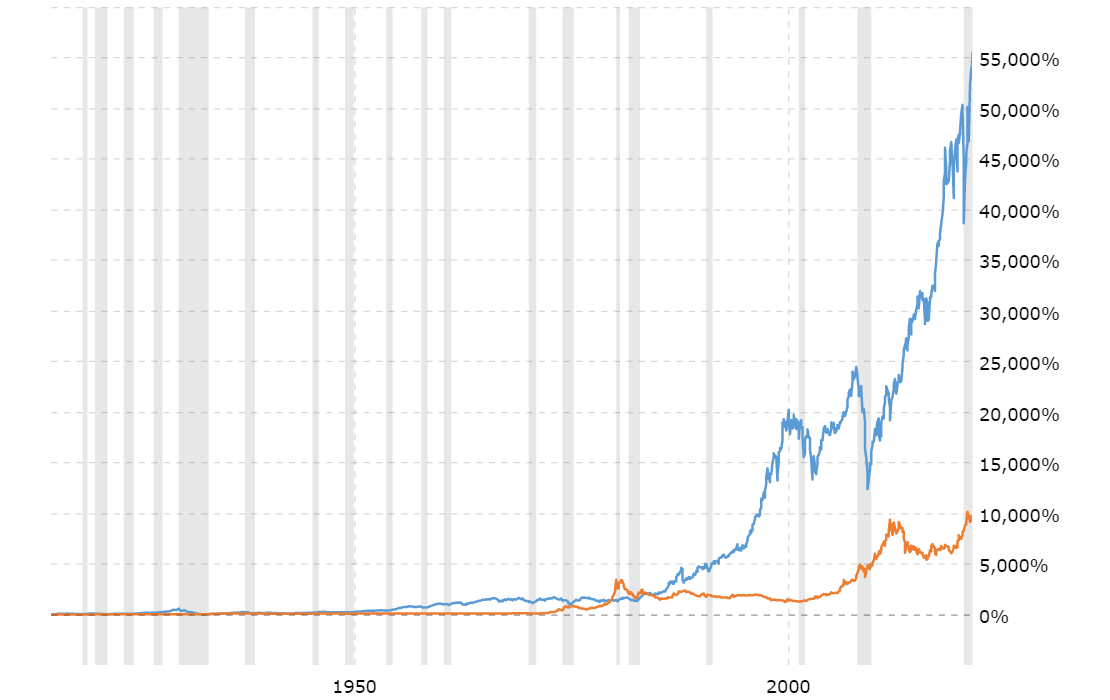
1.Gold Price vs. Dow Jones Industrial Average – 100 Year Return:
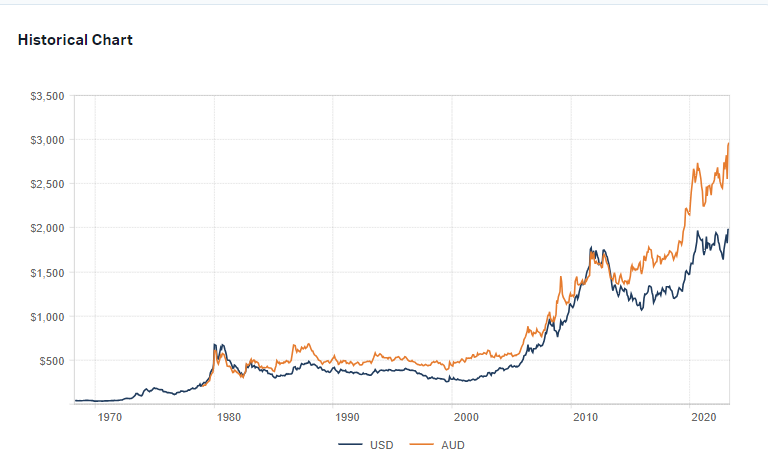
Through the end of Jan, 2021 gold returned around 9,500% while Dow Jones return exceeded 52,000% over the last 100 years.
Click to enlarge
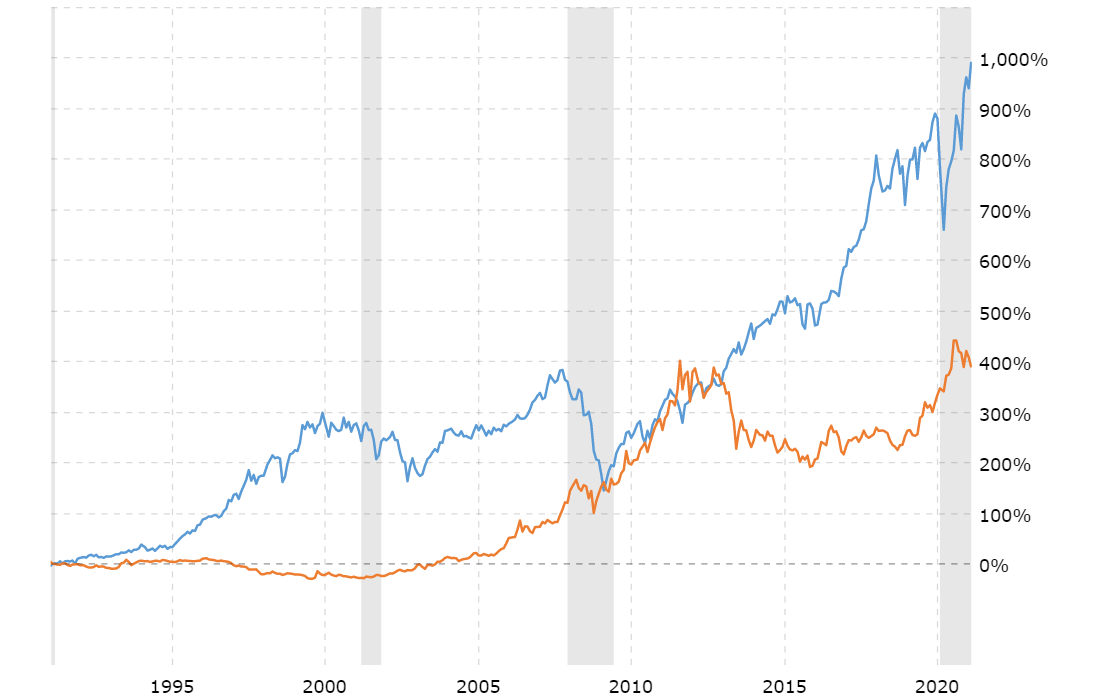
2.Gold Price vs. Dow Jones Industrial Average – 30 Year Return:
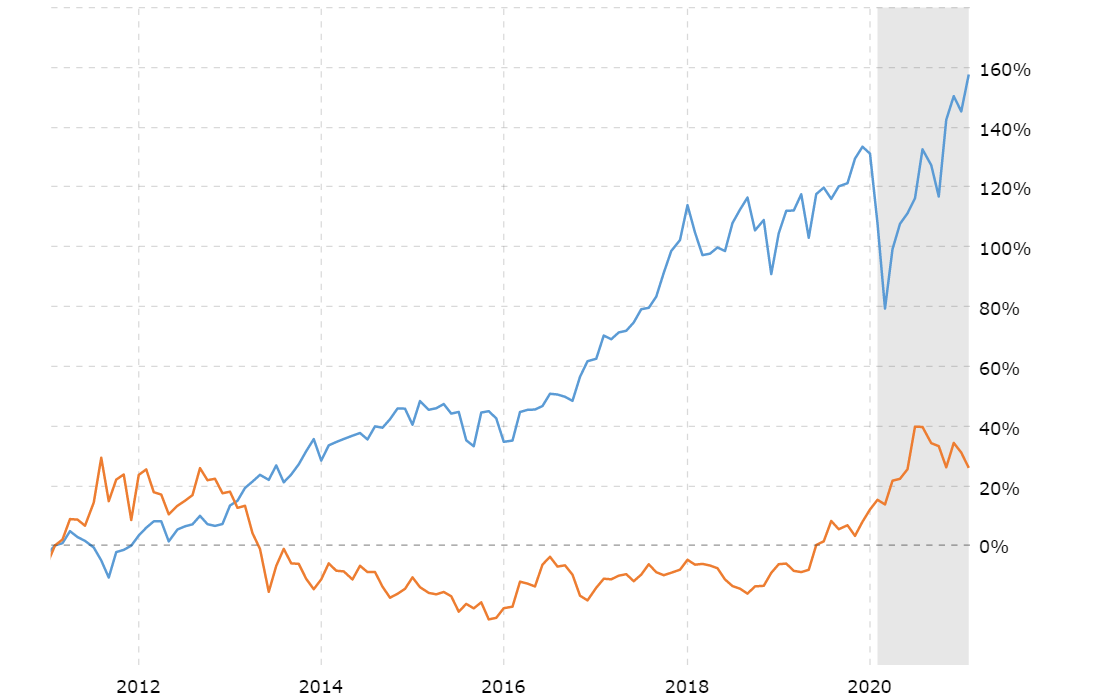
3.Gold Price vs. Dow Jones Industrial Average – 10 Year Return:
Over the past 10 years, Dow has grown 158%. But gold increased by just 26%.
Notes:
1.Blue is Dow Jones and Orange is gold returns
2.Shaded lines represent recessions
Source: MacroTrends
Related ETFs:
Disclosure: No Positions