Stocks are the best asset class to own especially over the long-term. Equities not only provide superior returns but also help beat inflation. For income investors, well established high-quality companies can offer excellent dividends. Stocks outperforming other assets has been proven by studies in many major markets. In this post, let us take a look at the example of the Australian equity market.
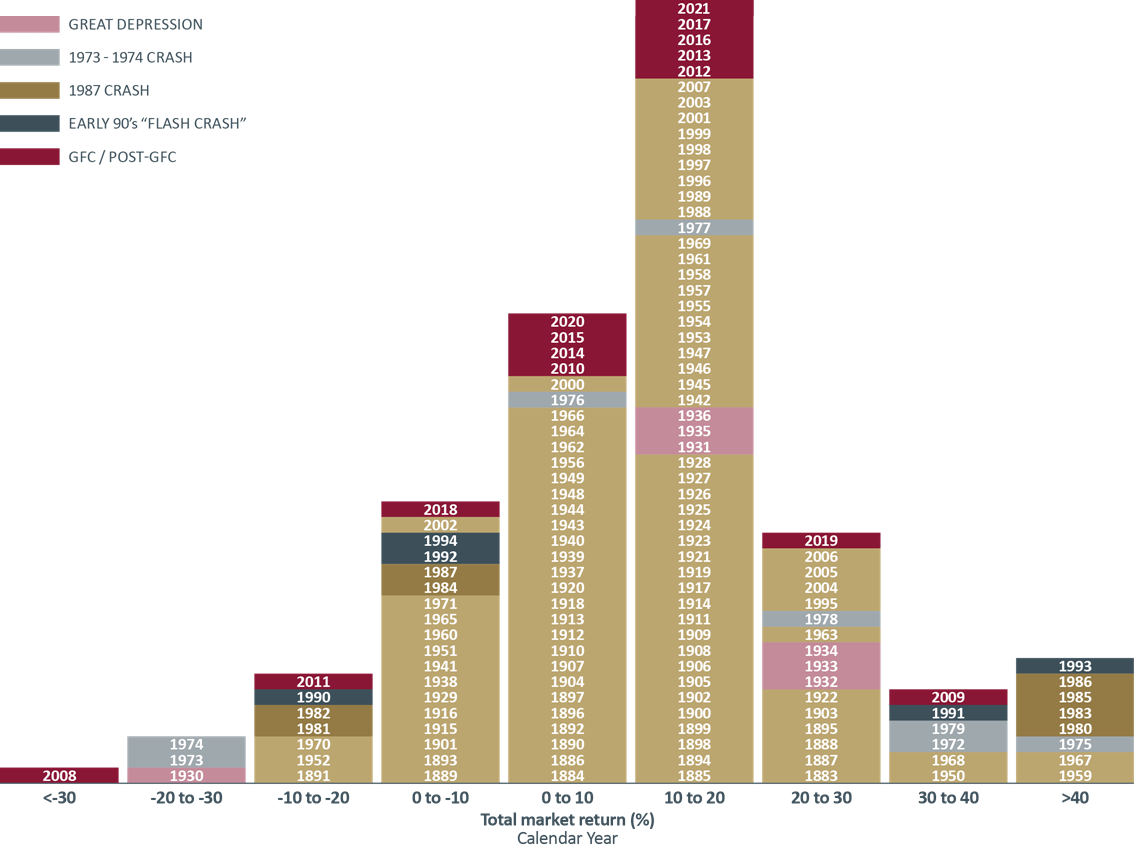
The following chart shows the historical total annual returns of the Australian equities from 1893 thru 2021:
Click to enlarge
Source: Three all-time best tables for every adviser and investor by Romano Sala Tenna, Katana Asset Management
The following is an excerpt from the above linked article:
Crashes are inevitable. Be ready and don’t panic at the bottom. In fact, the best time to panic is at the top.
Case in point. There has only been one (calendar) year in the 146-year history where the market fell by 30% or more, in 2008. But if you panicked and sold during that crash, you would have missed an extraordinary recovery. In 2009 the market was up by 39.6% and rose in 11 of the 13 years following the crash, including by 18.8% in 2012, 19.7% in 2013 and 24% in 2019.
Know thyself. If you are prone to doing the wrong thing at the wrong time, stay out of the stock market. Or work with a trusted financial adviser who can coach you through such periods.
As I mentioned in the introduction, the author also notes that the only way is up in the long-term. However in the short run markets can be volatile.
Earlier:
Related ETF:
- iShares MSCI Australia ETF (EWA)
Disclosure: No positions