US stocks have performed well during some periods in the past while their overseas peers have outperformed in other periods. For more than 10 years thru September of 2021, US equities have had an excellent run. However this outperformance may not last forever and foreign stocks may take their lead soon. According to an article at Hartford Funds:
Since 1975, the outperformance cycle for US versus international stocks has lasted an average of 7.8 years. We’re currently 10.5 years into the current cycle of US outperformance, which suggests the tides may be getting ready to turn.
Click to enlarge
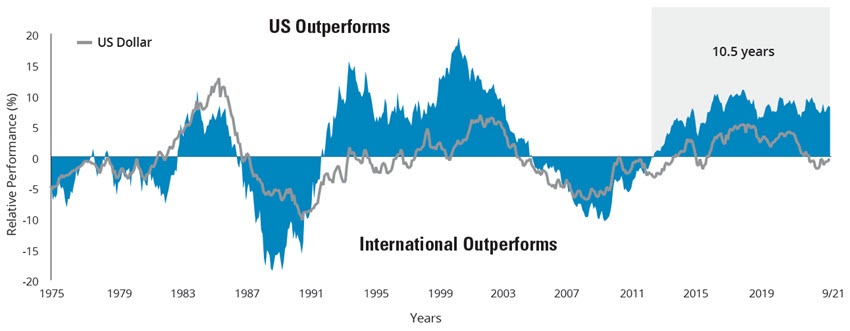
The chart shows the values of the S&P 500 Index’s returns minus the MSCI World ex USA Index’s returns. When the line is above 0, domestic stocks outperformed international stocks. When the line is below 0, international stocks outperformed domestic stocks.
Data Sources: Morningstar and Hartford Funds, 10/21.
Past performance does not guarantee future results. The performance shown above is index performance and is not representative of any Hartford Fund’s performance. Indices are unmanaged and not available for direct investment.
US equity is represented by the S&P 500 Index; International equity is represented by the MSCI World ex USA Index. Please see below for representative index definitions. For illustrative purposes only.
Source: US and international equities have traded periods of outperformance, Hartford Funds


