South Africa has a population of about 48 million. After years of apartheid rule the country held multi-racial elections in 1994 leading to the rule by the African National Congress (ANC). Since that time the country’s economy has grown although modestly. While blacks led by the late Nelson Mandela were able to gain political power from the minority whites, infighting and other issues have continued to adversely impact economic growth and preventing the country from realizing its full potential.
The South African economy is the largest in Africa with a GDP of about $353.9 billion in 2013. The GDP is projected to grow by 2.7% according to The World Bank.
The following is a brief overview of the South African economy from CIA’s The World Factbook site:
South Africa is a middle-income, emerging market with an abundant supply of natural resources; well-developed financial, legal, communications, energy, and transport sectors and a stock exchange that is the 15th largest in the world. Even though the country possesses modern infrastructure that support a relatively efficient distribution of goods to major urban centers throughout the region, unstable electricity supplies retard growth. The global financial crisis reduced commodity prices and world demand. GDP fell nearly 2% in 2009 but has recovered since then. Unemployment, poverty, and inequality remain a challenge, with official unemployment at nearly 25% of the work force. Eskom, the state-run power company, has built two new power stations and installed new power demand management programs to improve power grid reliability. South Africa’s economic policy has focused on controlling inflation, however, the country has had significant budget deficits that restrict its ability to deal with pressing economic problems. The current government faces growing pressure from special interest groups to use state-owned enterprises to deliver basic services to low-income areas and to increase job growth.
Source: The World Factbook, CIA
South Africa’s major exports are gold, diamonds, platinum, other metals and minerals, machinery and equipment and major imports are machinery and equipment, chemicals, petroleum products, scientific instruments, foodstuffs. Its major trading partners are China, India, Germany, Saudi Arabia, the US and Japan.
The benchmark stock index of South Africa is the FTSE/JSE Africa All Share Index. The index is a market capitalization weighted index and represents 99% of the full market capital value of all all the listed companies on the Johannesburg Stock Exchange. There are 165 constituents in the index and the top 10 holdings account for about 60% of the total. Nearly one-fourth of the index is comprised of firms in the basic resources sector.
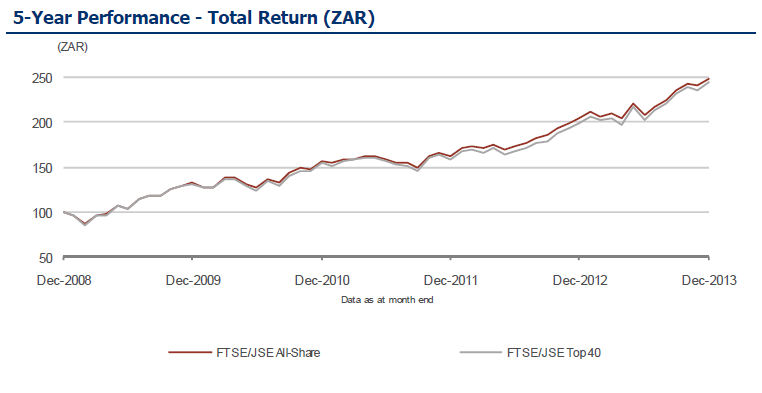
The following chart shows the performance of the index from 2008 thru 2013 in local currency:
Click to enlarge
Source: FTSE
The historical returns by year for this index can be found here and the total returns can be found here.
The top holdings in the FTSE/JSE All-Share Index are listed below with the ADR tickers and current dividend yields:
1.Company: BHP Billiton (BBL)
Current Dividend Yield: 3.68%
Sector: Mining
2.Company: Compagnie Financiere Richemont AG
Sector: Personal Goods
3.Company: SABMiller PLC (SBMRY)
Current Dividend Yield: 1.04%
Sector: Beverages
4.Company: Naspers (NPSNY)
Current Dividend Yield: 0.32%
Sector: Media
5.Company: MTN Group (MTNOY)
Current Dividend Yield: 8.01%
Sector: Mobile Telecom
6.Company: Anglo American PLC (AAUKY)
Current Dividend Yield: 3.46%
Sector: Mining
7.Company: Sasol (SSL)
Current Dividend Yield: 3.63%
Sector: Oil & Gas Producers
8.Company: British American Tobacco PLC (BTI)
Current Dividend Yield: 4.26%
Sector: Tobacco
9.Company: Standard Bank Group (SGBLY)
Current Dividend Yield: 4.20%
Sector: Banking
10.Company: Old Mutual Plc (ODMTY)
Current Dividend Yield: 3.40%
Sector: Life Insurance
Note: Dividend yields noted above are as of Mar 7, 2014. Data is known to be accurate from sources used.Please use your own due diligence before making any investment decisions.
Related ETF:
- iShares MSCI South Africa Index Fund (EZA)
Disclosure: No Positions
Also see:
- South Africa’s FTSE/JSE All-Share Index Returns By Year
- South Africa FTSE/JSE All Share Index: Historical Total Returns Chart


Please could you send me a copy of the JSE all share graph 1929 to current.
Thank you
Regards
Peter
Sure. You can find the chart on this site here:
South Africa FTSE/JSE All Share Index: Historical Total Returns Chart
https://topforeignstocks.com/2010/11/27/south-africa-ftsejse-all-share-index-historical-total-returns-chart/
It goes from 1926 to 2009.Thx.