The NASDAQ-100 index represents the largest 101 non-financial companies listed on the NASDAQ exchange. It is a modified capitalization-weighted index. The S&P 500 index on the other hand is a free-float capitalization-weighted index is composed of the largest 500 companies trading on the US markets. The S&P 500 is more representative of the US economy while the NASDAQ index is heavily focused on technology. Since the tech sector has performed very well in the past few years, the NASDAQ-100 has outperformed the S&P 500 by a wide margin as shown in the chart below:
Click to enlarge
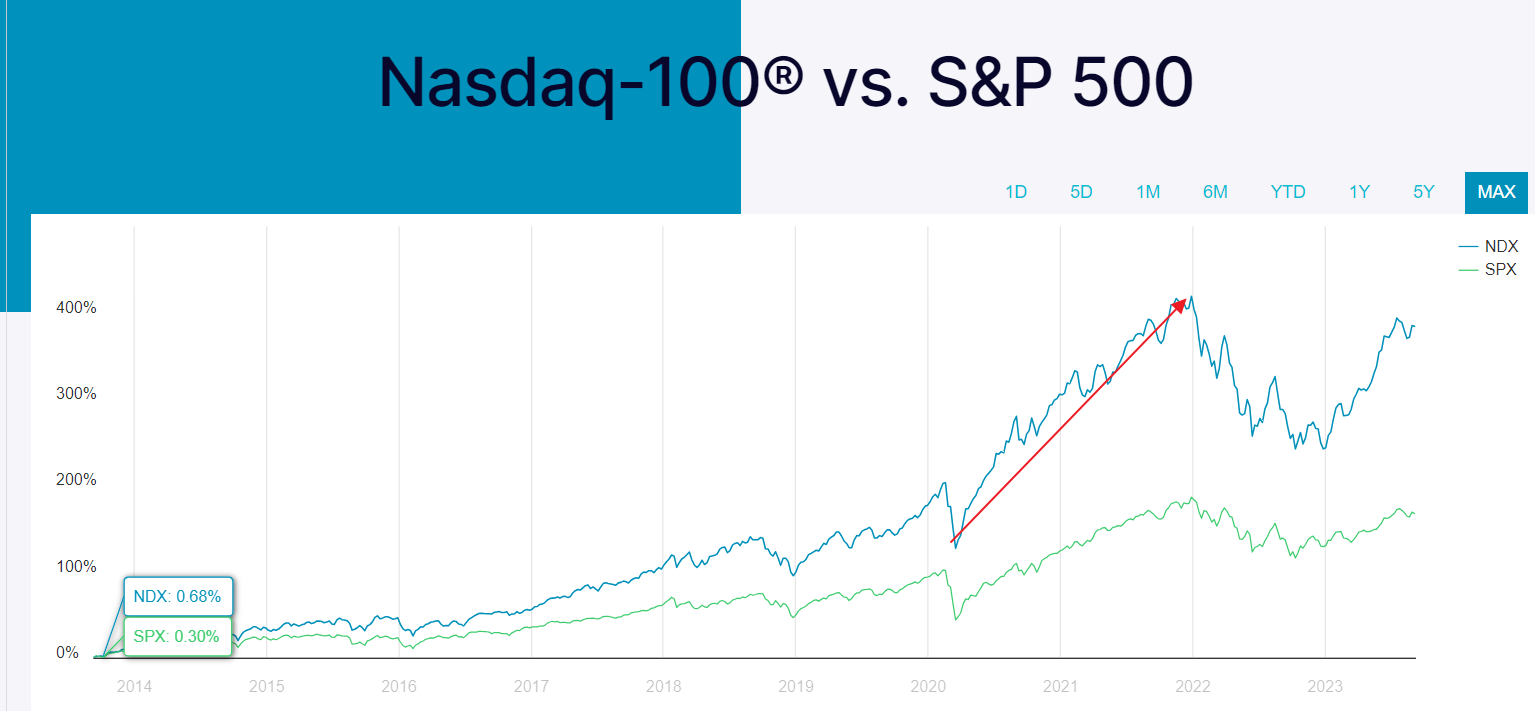
Source: NASDAQ
The following chart shows the sector composition of the NASDAQ-100:
Click to enlarge
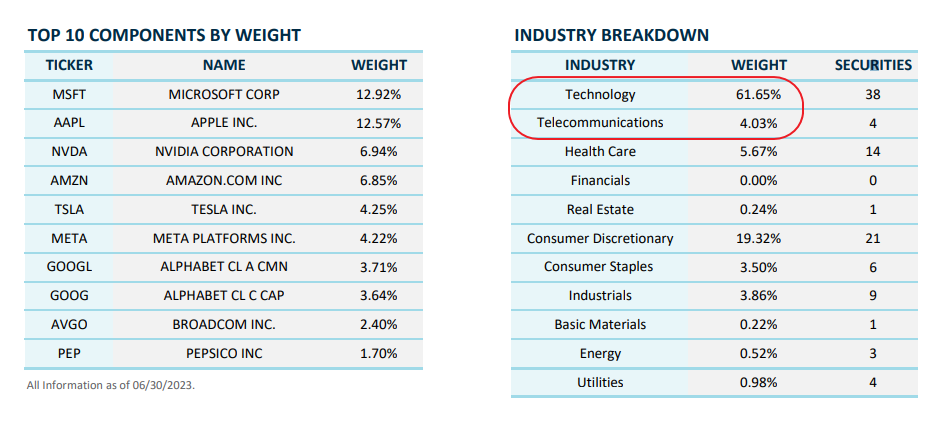
Source: NASDAQ
The the sector breakdown of the S&P 500 index:
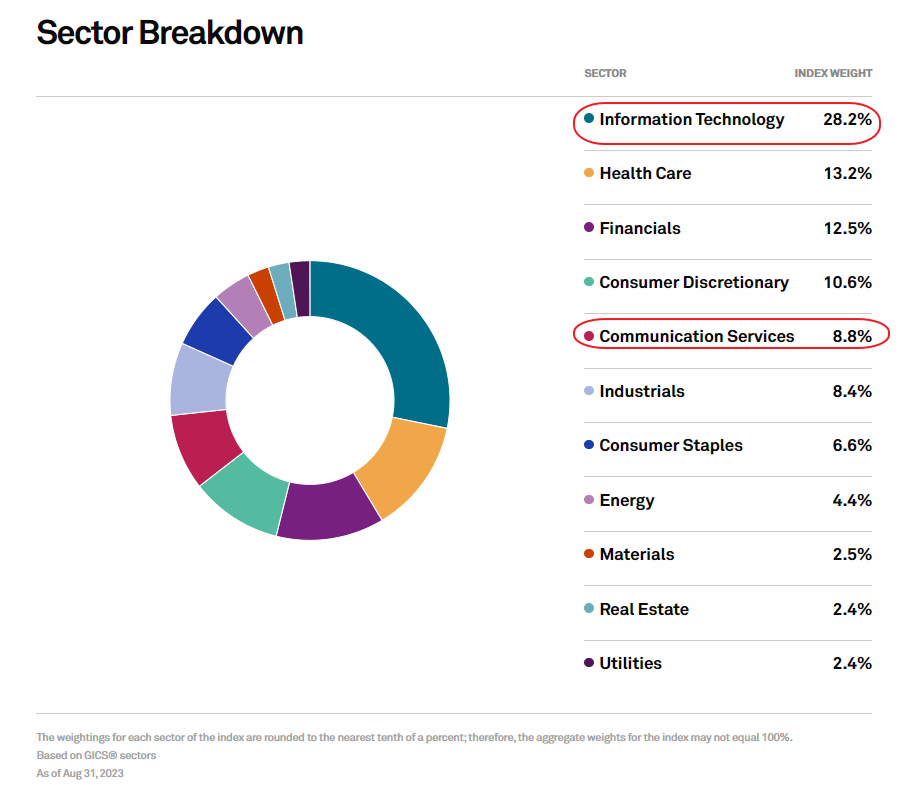
Source: S&P
At the end of second quarter, tech sector accounted for about 62% of the NASDAQ-100. If we add Telecommunications the weightage increases further to 66%. In the S&P 500, tech’s weightage is 28%. Even with the addition of Telecom the total comes to just 37%. Thus the high allocation of tech in the NASDAQ index is helping fuel the huge rally.
Financials account for over 12% of the S&P 500 while it has no allocation in the NASDAQ-100. The crash in bank stocks this year has adversely impacted the S&P 500 while NASDAQ-100 remains unscathed.
Consumer Discretionary has a high allocation in the NASDAQ-100 at 20%. If the US economy goes into a recession this sector is bound to get crushed. In the S&P 500 it accounts for about 10%.
Overall though NASDAQ-100 is soaring this year relative to the S&P 500, risk remains high for NASDAQ stocks. So investors need to take that into consideration when making investment decisions.
Related ETFs:
Disclosure: No positions


