Equity markets have always something to worry about. There is always one crisis or another that pops up in this world. Not a single year goes by without a negative event happening. However the beauty of the markets is that they always climb the wall of worry to maintain an upward trajectory. Recently I came across the following chart that shows the timeline of all the negative events from 1990 to 2022. Most of these events caused worry to investors if the markets would crash and if they should get out. A few of these events include the Brexit, Global Financial Crisis and most recently the Covid-19 pandemic. Despite all these and other noted events the MSCI World Index continued to go higher and higher each year. Though the chart ended with 2022 data, if we extend it to 2023 or even up until now the chart would reach much higher records since markets soared last year and year-to-date this year.
Click to enlarge
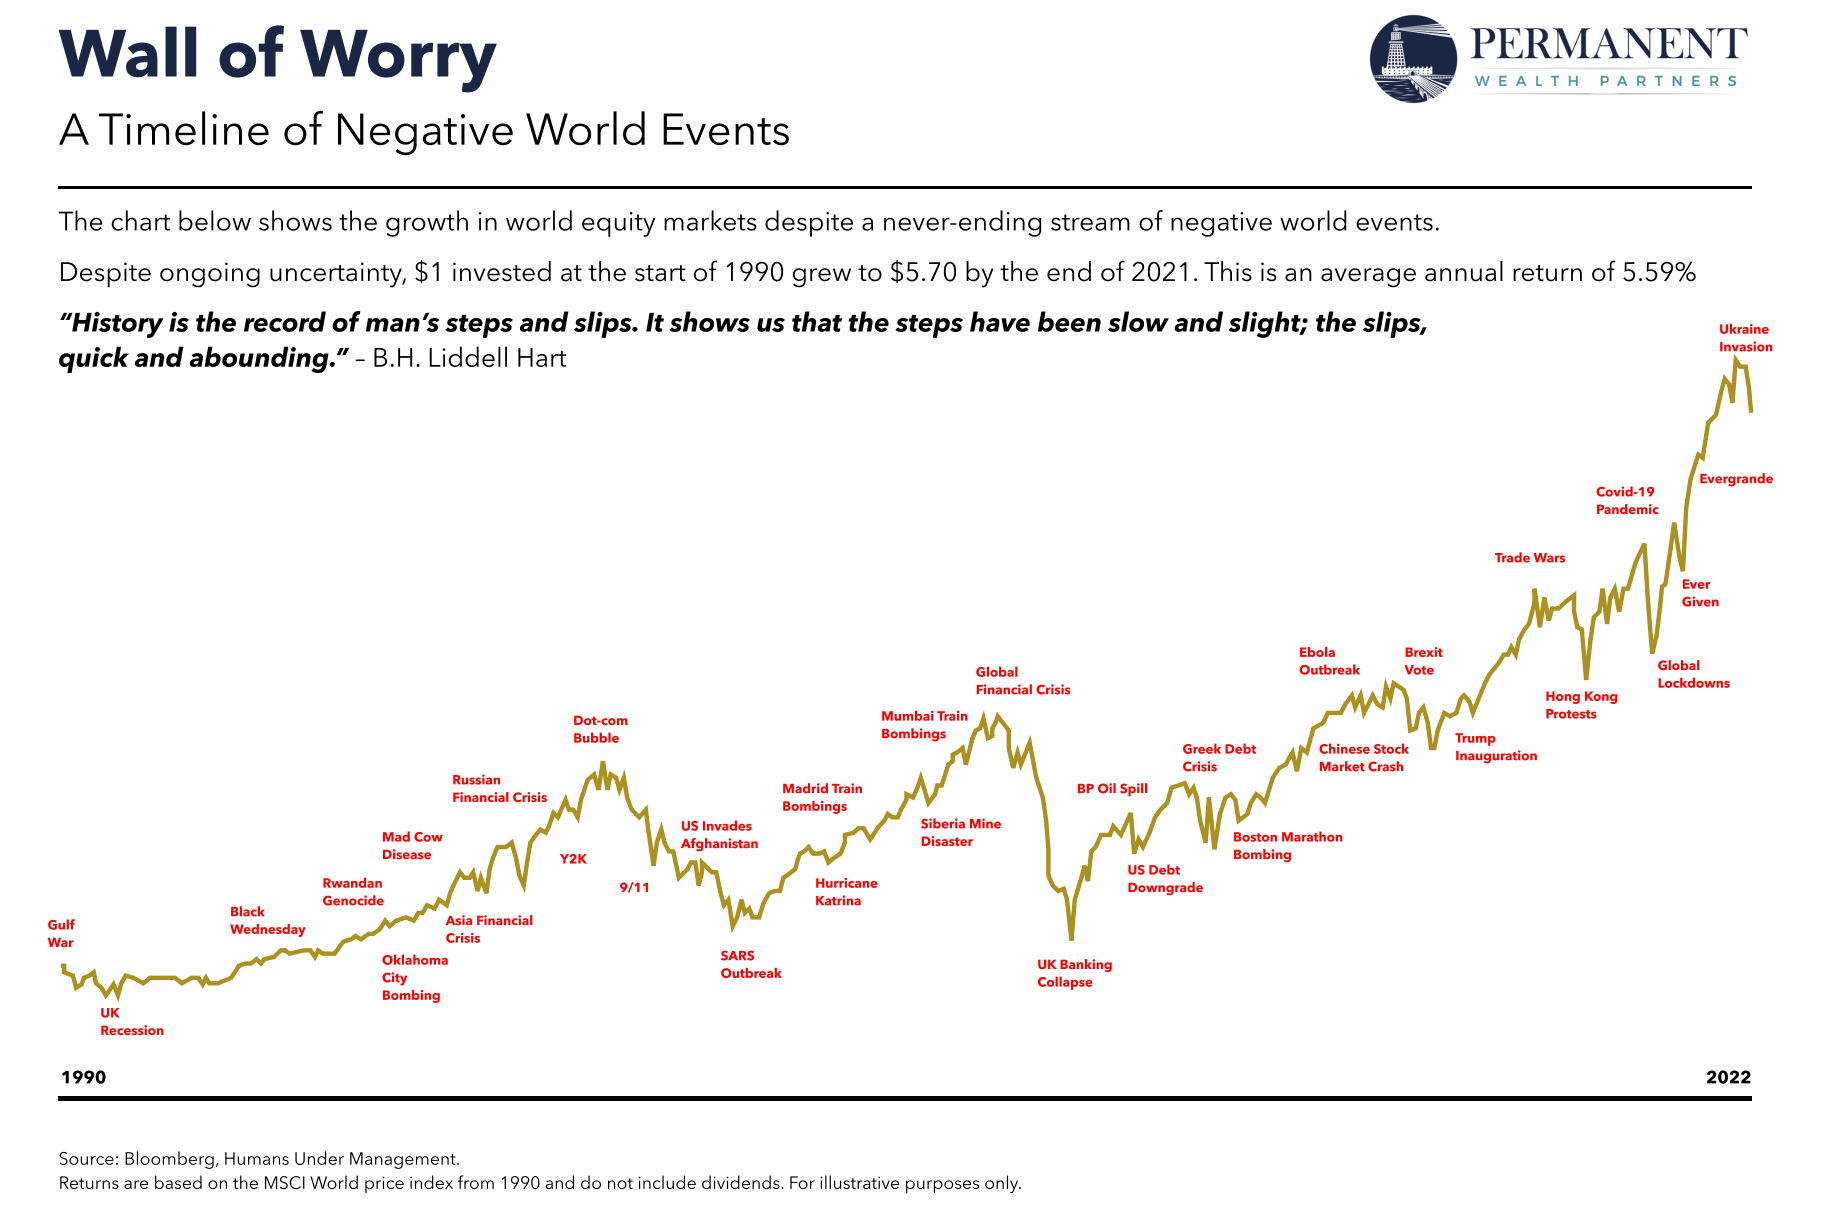
Source: The view from Barley Mow, Permanent Wealth Partners
The key takeaway for investors is that negative events should not be a reason to sell out equities. Markets have always a tendency to be volatile in the short-term when some adverse event occurs but they recover eventually.
Related ETFs:
- SPDR S&P 500 ETF (SPY)
- iShares Core S&P 500 ETF (IVV)
- Vanguard S&P 500 ETF (VOO)
- iShares MSCI Emerging Markets ETF (EEM)
- Vanguard Developed Markets Index Fund ETF (VEA)
Disclosure: No positions


