The S&P 500 is down just over 16% so far this year as of Nov 25th. The index was down much more earlier in the ongoing bear market. From June thru mid-August stocks recovered only to plunge again. So wise investors are cautiously waiting if the current rise from October will stand. Many market participants consider it as another bear market rally. Should the Fed continue to raise interest rates further at a strong clip each time, the economy could enter a recession early next year. Of course that would not be good for stocks. It is anybody’s guess on how much equities could fall in a recession.
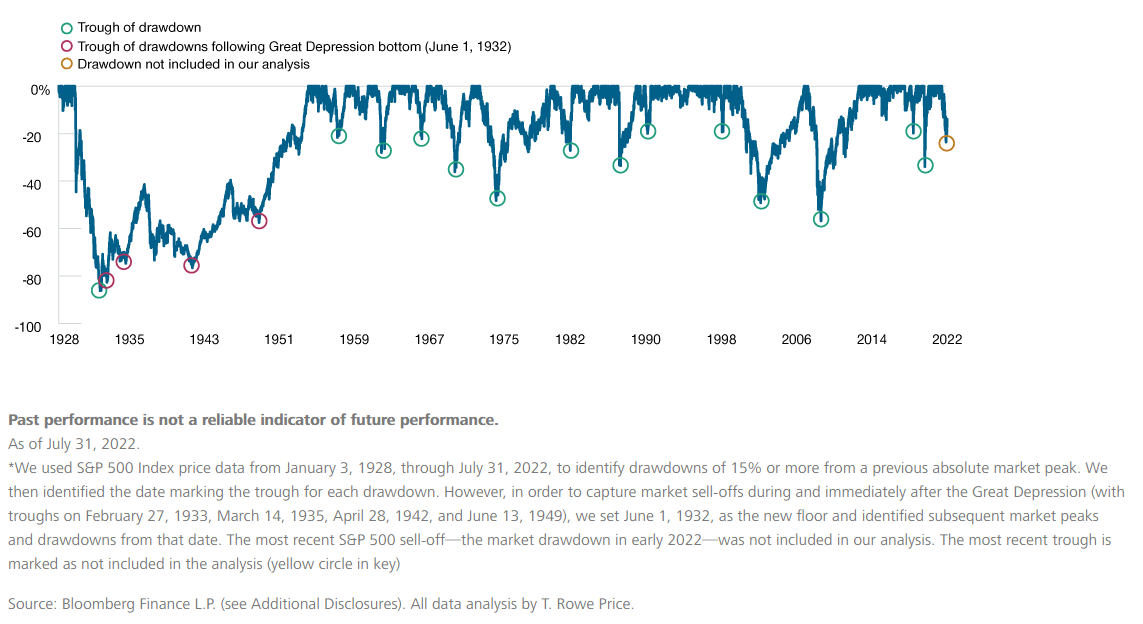
Drawdowns of 15% or more in the S&P 500 have occurred many times in the past. Some of these declines were severe. The last major drawdown occurred during the Global Financial Crisis(GFC) of 2006-08. The following chart shows the historical drawdowns in the S&P 500 since 1928:
Click to enlarge
Source: Contrarian Investing During a Sell-Off: An Update, T. Rowe Price, September 2022 via Investment Office
Related ETF:
- SPDR S&P 500 ETF (SPY)
Disclosure: No positions


