Higher economic growth does not necessarily lead to higher equity market returns and vice versa. I have written about this concept many times before. So it is wise not to invest in the equities of a country just because the economy is growing strongly. Over the past three decades or so, China and India have emerged as the major markets in the developing world. While India is the world’s largest democracy China is a communist state that follows “market socialism”.
China has had an astonishing economic growth in the past few decades compared to India. This tremendous growth is reflected in the GDP and GDP per capita figures. For instance, the GDP of China was nearly $18 Trillion in 2021 whereas India’s GDP was just over $3.0 Trillion. Similarly the GDP per capita of China in 2021 was $12,556 while India’s was just $2,277 according to The World Bank.
However when it comes to equity markets, Indian stocks have outperformed Chinese stocks by a huge margin in the past 30 years. From a recent article at Wellington Management:
Consider three major global equity markets: China, India, and the US. Of the three, would you believe India has been the second-best performer over the past 30 years, well ahead of China? It’s true.
Figure 1 shows the cumulative total returns posted by the S&P 500 Index, the MSCI China Index, and the MSCI India Index from 31 December 1992 through 30 April 2022. Our clients have been uniformly surprised that China’s long-term performance has been so much lower than that of the US and India, especially given all the investor focus on China in recent years. And they’ve been even more surprised that India – a market many clients have more or less ignored – has fared so well over the long run.
Click to enlarge
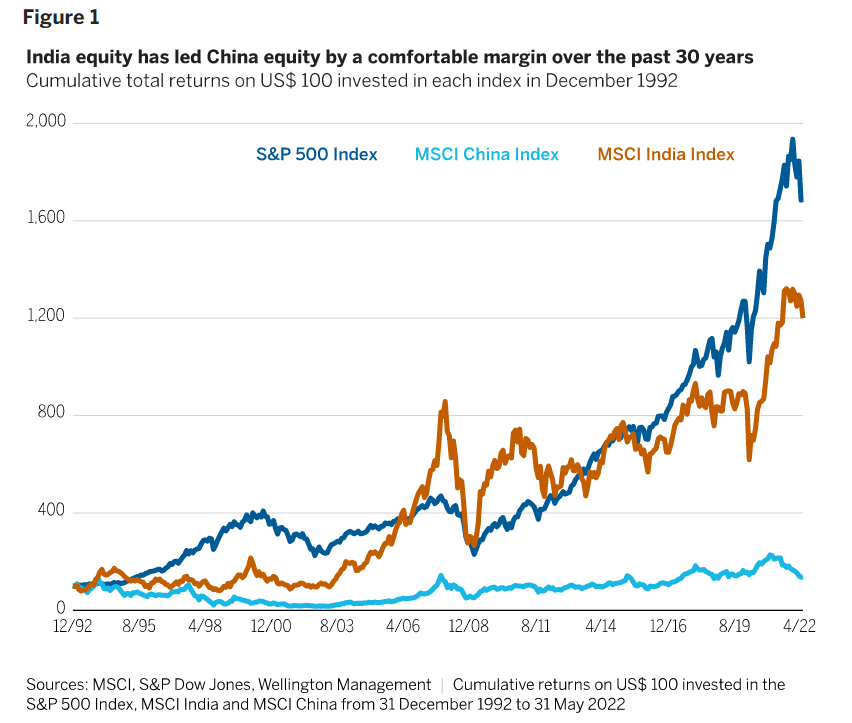
Source: India equity: An unsung long-term performance story, Wellington Management
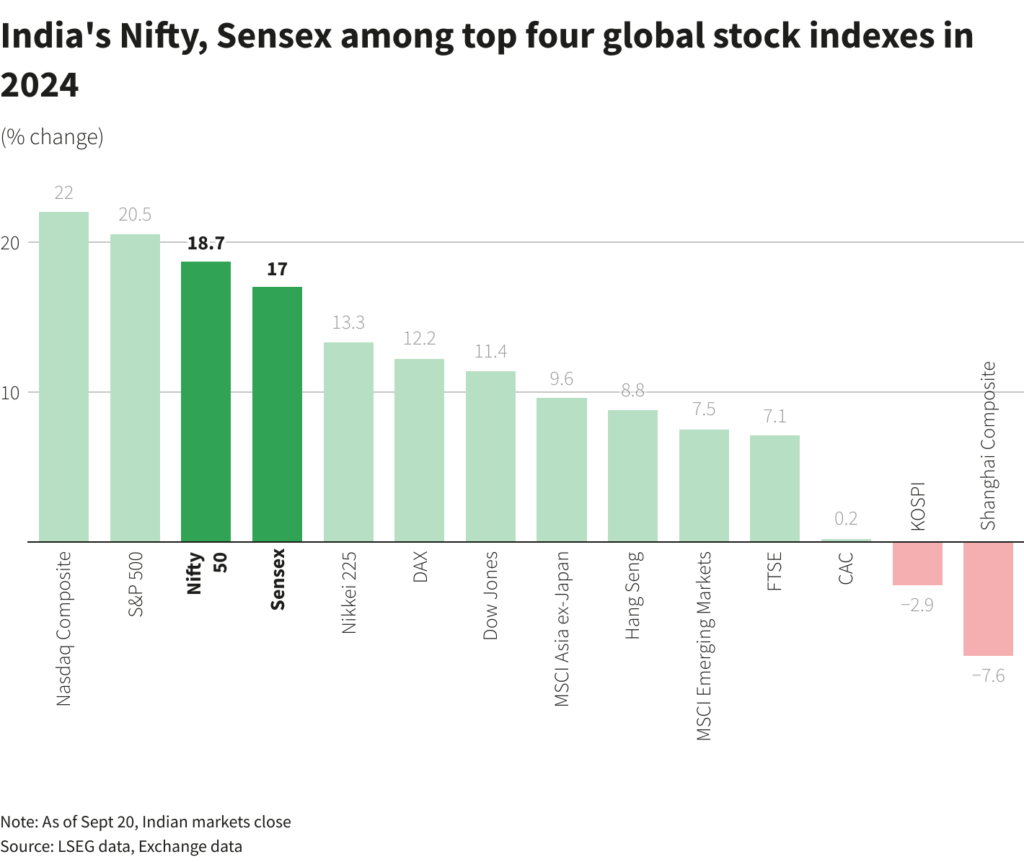
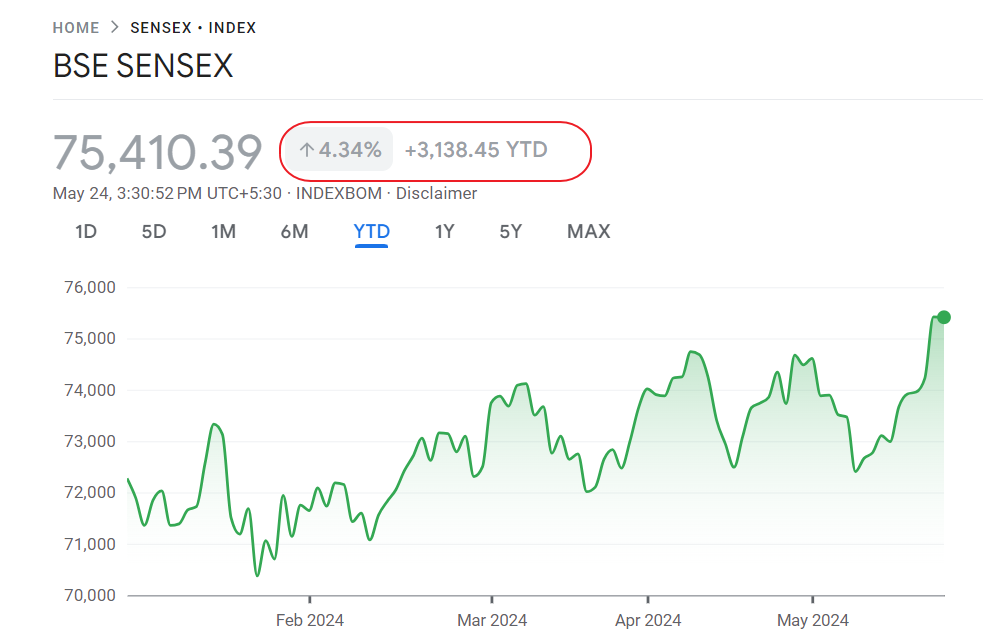
Most emerging markets are in bear markets similar to most developed markets this year. However one standout is India. India’s Sensex is up by over 5% in local currency terms and nearly 7% in US dollars YTD. The index reached an all-time high of 62,447 this year.
Click to enlarge
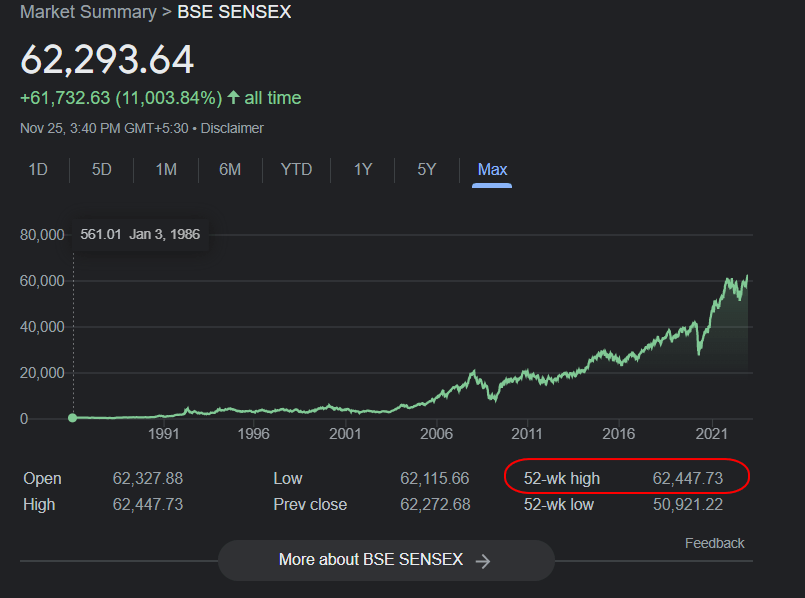
Source: Google Finance
Below is another chart showing how Indian equities have trounced Chinese equities over the past 30 years:
Click to enlarge
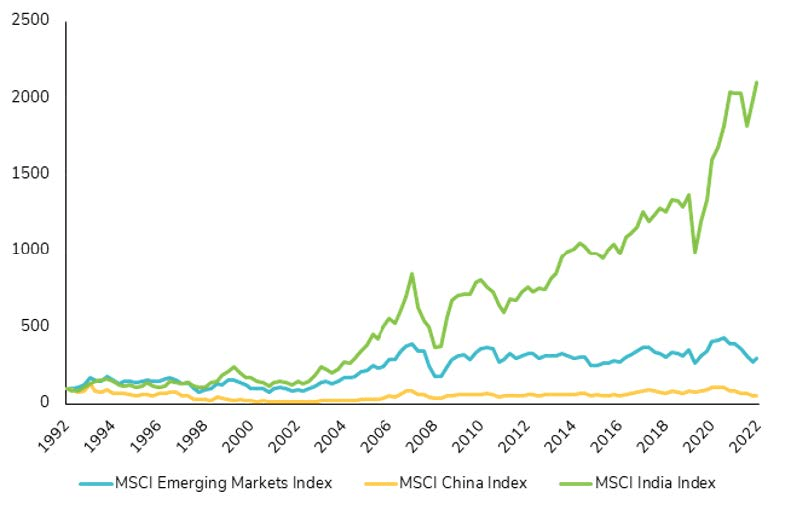
Source: The decade of Indian equities?, SYZ Group
The author of the article is bullish on Indian stocks. He concluded with the below points:
Historically, investors have underestimated Indian equities due to India’s underrepresentation in emerging market indices (11% while GDP represents 45%) and a misperception of risks such as liquidity or market concentration.
In the medium to long term, India should benefit from several favorable winds such as digitalization, the growth of direct-to-consumer trade and the geopolitical reshaping of supply chains.
The biggest risk to this market is a significant and sustained rise in commodity prices, which could negatively impact India’s current and fiscal accounts and push inflation higher.
The ongoing changes in the Indian economy are not fully reflected in the benchmarks. The best way to capture opportunities is to carefully select companies through fundamental and bottom-up research.
Update (12/10/22):
India vs. Other Emerging Markets since 2012:
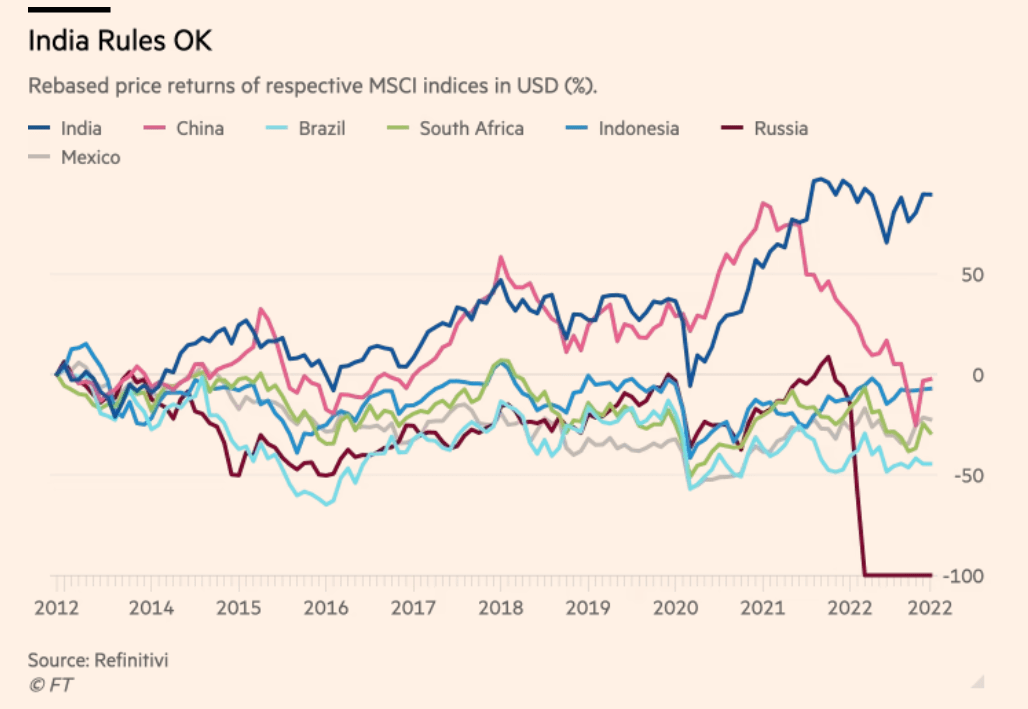
Source: India takes off?, FT Alphaville
Related ETFs:
- WisdomTree India Earnings (EPI)
- iShares S&P India Nifty 50 Index Fund(INDY)
- PowerShares India ETF (PIN)
Disclosure: No positions