The technology sector has performed extremely well in the past few years up until the end of 2020. However not all stocks within the sector have been winners. In order to have accumulated fabulous wealth with tech stocks it was necessary to be invested in the right stocks. For instance, an investor who owned tech giants IBM(IBM), Oracle (ORCL) or Cisco(CSCO) from Jan 2013 thru November would have earned average returns relative to the wealth generated by stocks like Amazon(AMZN), Microsoft(MSFT) or Apple(AAPL) in the same period. The following chart shows the stark difference in returns:
Click to enlarge
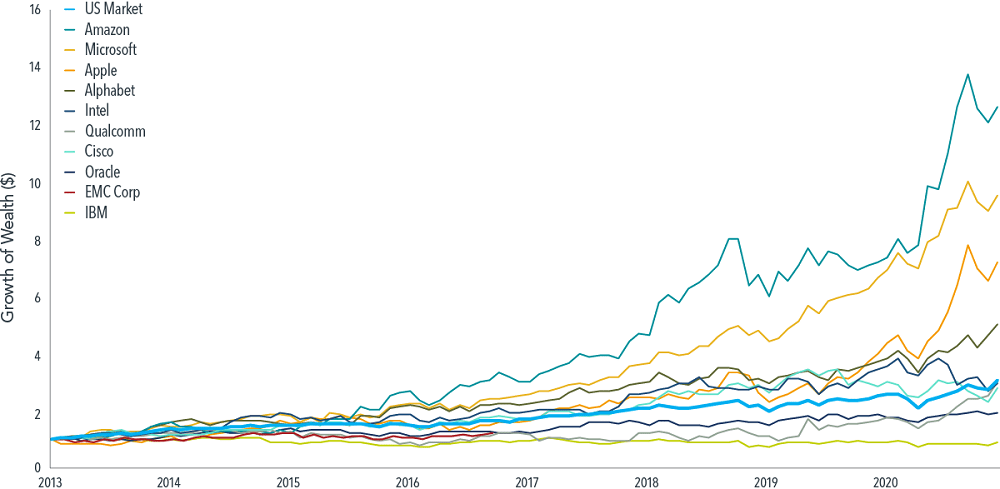
Exhibit 3: Growth of wealth for 10 largest US technology stocks
Source: FANMAG: Because FAANGs are so yesterday, Ishan Ghosh PhD, Dimensional Fund Advisors via Firstlinks, Australia
From the above article:
Exhibit 3 shows the hypothetical growth of wealth for an investor who put $1 in each of the 10 largest technology stocks and the US market in January 2013. While the $1 invested in Amazon and Apple, for example, would have grown to $12.63 and $7.18, respectively, by November 2020, the returns of their non-FANMAG tech contemporaries would have failed to even surpass the US market.
While the performance of the above tech stocks have been great, large US firms have done even better in the past. Their contribution to the return of the overall US market was even higher than tech stocks like Microsoft and Apple. Below is another excerpt from the piece:
Large US companies have done even better in the past
A defining trait of the FANMAG performance is that these outsize returns have come from among the largest companies in the US, implying they were meaningful contributors to the overall US market’s return. However, historical data show that this too is nothing new.
Defining a stock’s return contribution as its total return weighted by its beginning-of-period market capitalization weight, we see that Apple’s contribution to the US market for the period 2013–2020 was 19.68%.
How does this figure compare to other top return contributors? Exhibit 5 illustrates the top return contribution and the annualized US market return over rolling eight-year periods since 1927, revealing instances of return contributions by the likes of AT&T, General Motors, and General Electric that were comparable to, or even exceeded, that of Apple in 2013–2020.
Exhibit 5: Key contributors

Oil major Exxon Mobil’s (XOM) glorious days lasted from 1999 to 2012 as shown in the chart above. Similarly Detroit auto maker General Motors(GM) was a top contributor to the market’s return in the 1940s and 50s. Nowadays it is more of an also-ran company making average cars. Few years ago the market even dubbed it the “Government Motors” when Uncle Sam had to bail them out from total collapse.
Disclosure: No Positions


