Stocks tend to earn higher returns relative to other assets over the long-term. This is because despite corrections and bear markets that can occur on a regular basis, over many years stocks go up more than they go down. To put it another way bull market returns are higher than bear market declines most times. So the key point to remember is not to panic and sell out during bear markets or corrections. We have reviewed the bull and bear markets in the US, Canada and India before. In this post let’s take a look at the Bull and Bear markets in Australia as represented by the ASX All Ordinaries Price Index:
Click to enlarge
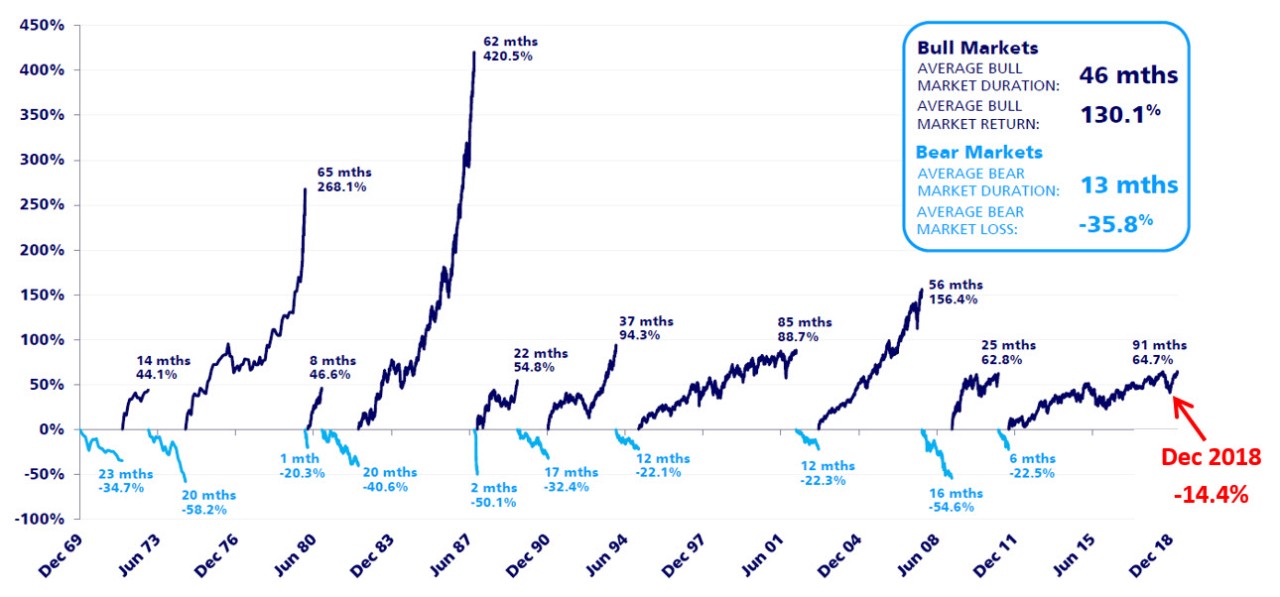
Source: Bull vs Bear, Zurich Australia
From 1970 thru 2019, there have been 10 bear markets in Australia. The duration of each bear market was 13 months and the average loss was 35%. On the other hand, the average bull market lasted 46 months with an average bull market return of 130%.
The chart also shows that while the bear market declines (light blue color) were sharp, the bull market rises were sharper.
Related ETF:
- iShares MSCI Australia ETF (EWA)
Disclosure: No positions