The Australian economy is one of the largest among the developed countries. With a GDP of about $1.5 Trillion the economy is smaller than the Canadian economy. Similar to Canada, Australia is also a resource-based economy. To put it another way, Australia mostly depends on simply digging up what’s under the ground and exporting to resource hungry countries such as China. The Reserve Bank of Australia published an excellent chart pack each month on the economy and financial markets. The following are select charts from the September edition of the report.
1.Cash Target Rate:
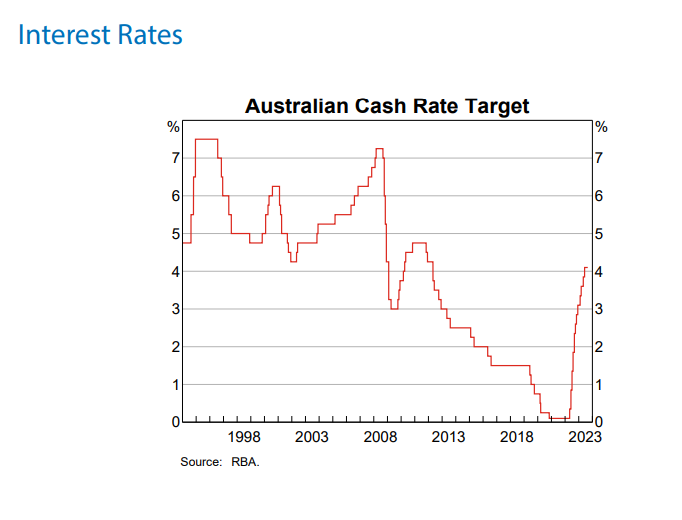
Similar to other developed countries, the Central Bank of Australia has increased interest many times from almost 0% and the cash rate has reached 4.10%.
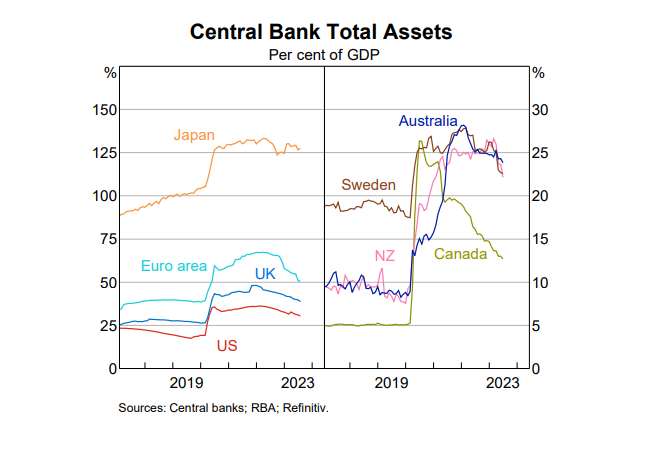
2.Central Bank Total Assets:
3.Consumer Price Inflation:
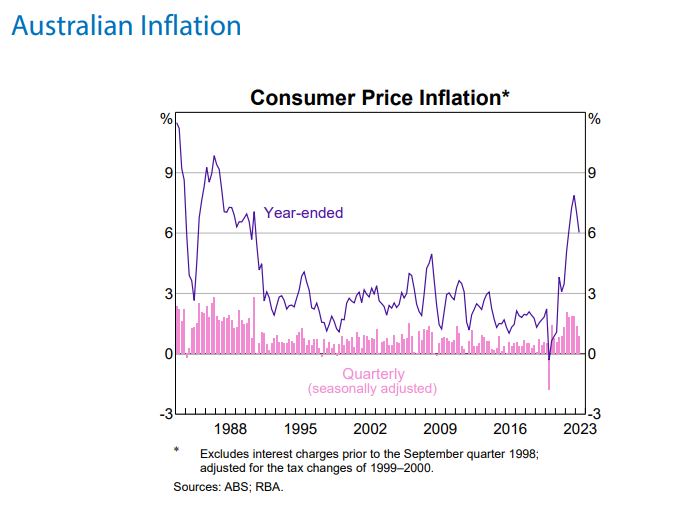
The official rate has started to decline from a peak 7.8% and has reached 6%.
4.Employment and Participation Rates:
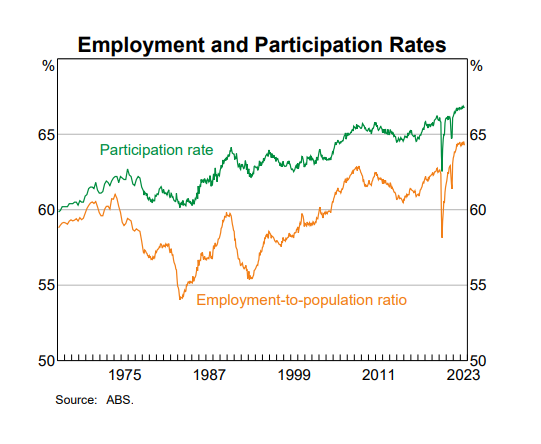
After dramatic declines during the covid-19 pandemic, labor participation rates have picked up strongly.
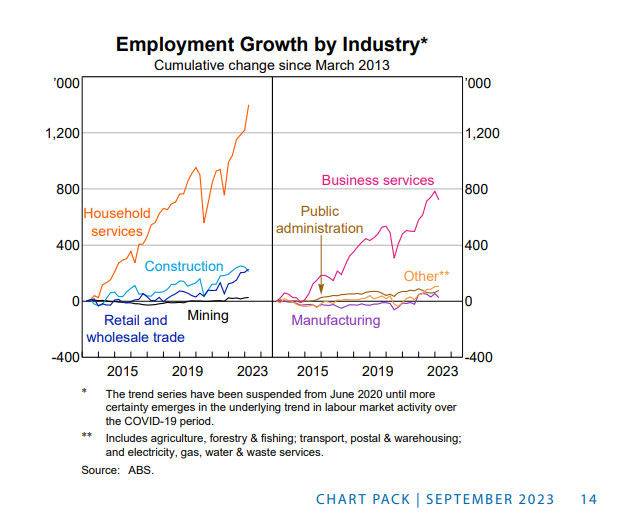
5.Employment growth by Industry:
6.Exports by Destination:
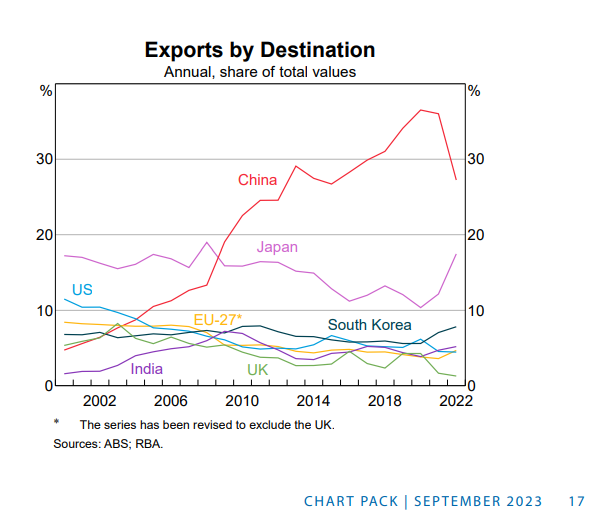
China is the largest export destination for many Australian resources particularly iron ore. As China’s economy has stagnated, the demand for commodities has declined leading to the sharp decline in Australian exports to China.
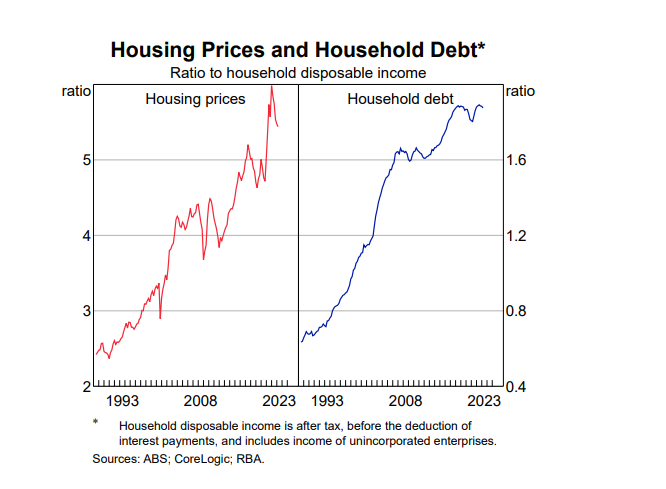
7.Housing Prices and Household Debt:
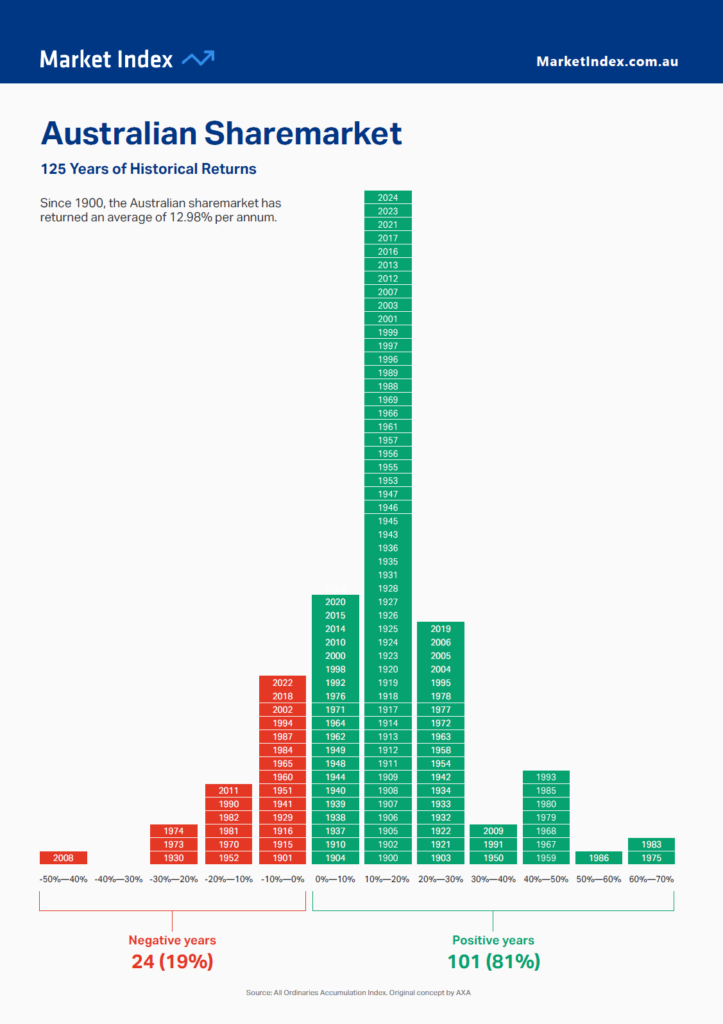
8.Australian Share Prices vs. US and World Share Prices:
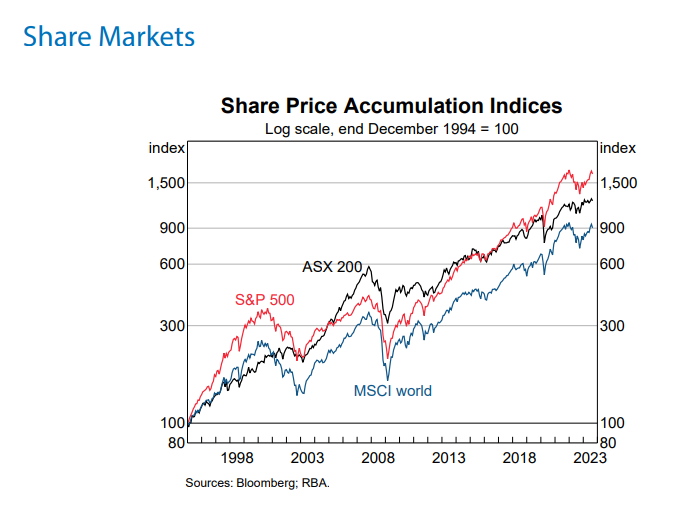
Australian equities as represented by the ASX 200 has underperformed US stocks for many years now. Global decline in commodity prices and demand could lead to further underperformance in the future.
Source: The Australian Economy and Financial Markets Chart Pack | August 2023, Reserve Bank of Australia