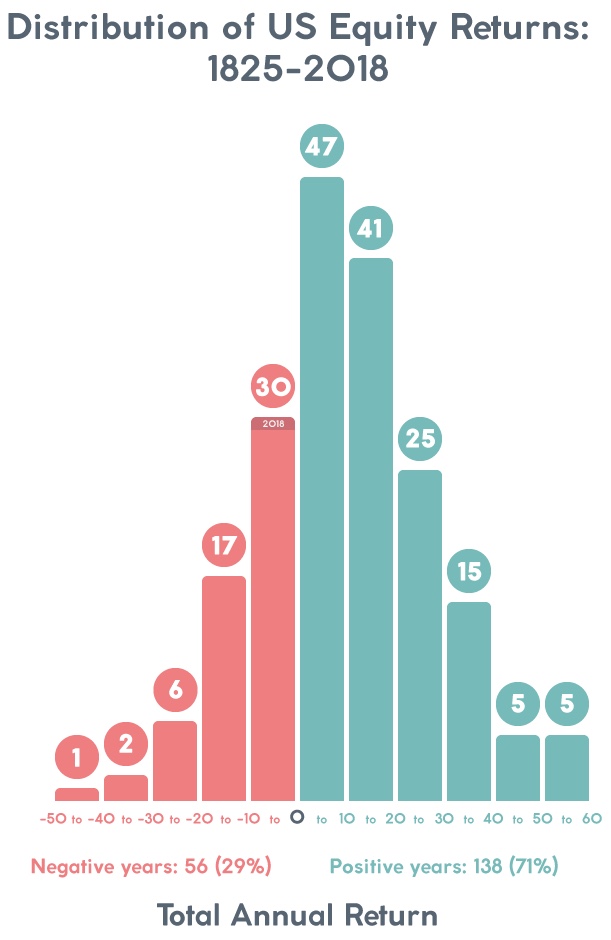
U.S. equities have returned positive returns in more years than negative returns based on historical data. Of the last 194 years, US stocks have yielded positive returns in 138 years (71% of the time) and negative returns in 56 years (29% of the time).
Click to enlarge
*Note that different sources of information (and index data collection methodologies) were used depending on the time period. The S&P 500 index was used from 1957 onwards and its predecessor S&P index from the period from 1923 to 1957. The data prior to that was computed by William Goetzmann, Roger Ibbotson et al. Source: “A new historical database for the NYSE 1815 to 1925: Performance and Predictability”, Journal of Financial Markets, Volume 4, Issue 1, January 2001, Page 1-32.
Data Source: Pyramid Distribution of US Equity Returns 1825 to 2017
Source: US equities: returns over the last 194 years, Moneybox


