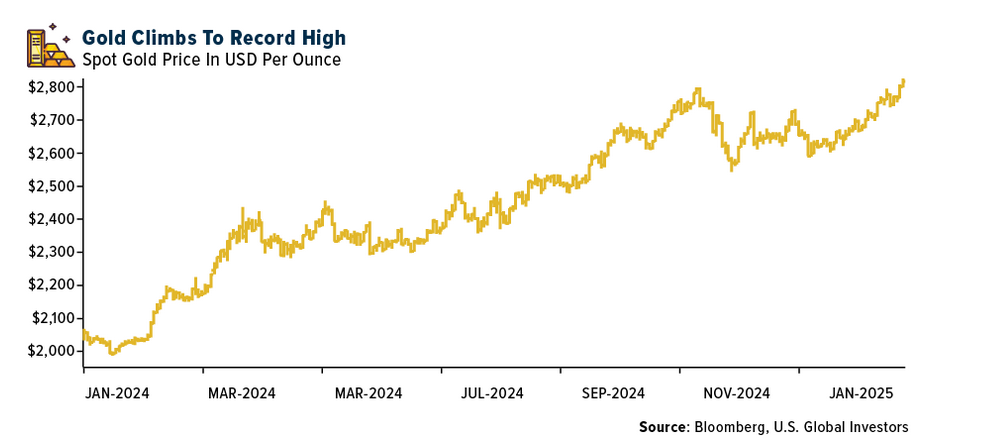
The price of gold continues its upward march. It has reached $1,060 an ounce on Tuesday October 20th due to the weak US dollar and investors choosing gold as an alternative to holding dollars.
Reuters reports:
“U.S. gold futures for December delivery GCZ9 were at $1,065.6 per ounce, up nearly 1 percent from $1,058.10 in the COMEX division of the New York Mercantile Exchange.
Last week, spot gold soared to an all-time high of $1,070.40 an ounce, while New York gold futures hit a record peak of $1,072 on the greenback’s weakness.
Near-term resistance is seen around $1,068, a level it took time to break through, when it hit a record high of $1.070.40 on Oct. 14. Support is seen at $1,055.43, the 10-day moving average.”
London,UK-based precious metals consultancy GFMS released the Gold Survey 2009 – Update 1 last month. Some of the charts from this report are presented below:
Gold Production

Gold Production – Winners and Losers

Gold Investors’ Net Positions

Top Gold Stocks Market Caps.

Top Gold Stocks’ Performance
The chart below shows the performance of the world’s top gold producers in the past ten months:

Source: GFMS Quarterly Newsletter, September 2009
To download the full presentation click: GFMS-Quarterly-Newsletter,September 2009