Page Updated: Mar 31, 2018
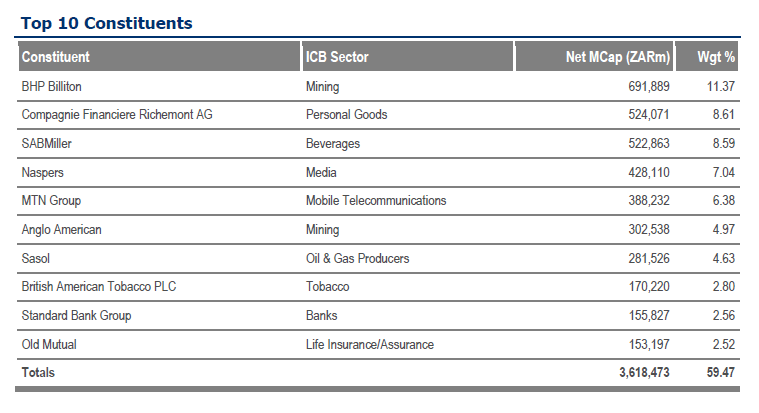
The FTSE/JSE All-Share Index is the leading benchmark of the South African equity market. It contains 165 companies listed on the Johannesburg Stock Exchange (JSE) based on market capitalization. The dividend yield of the index as of Dec 31, 2013 was 2.72%.
The Top 10 Holdings and the weights in the index at the end of 2013 are shown below:
Click to enlarge
Source: FTSE
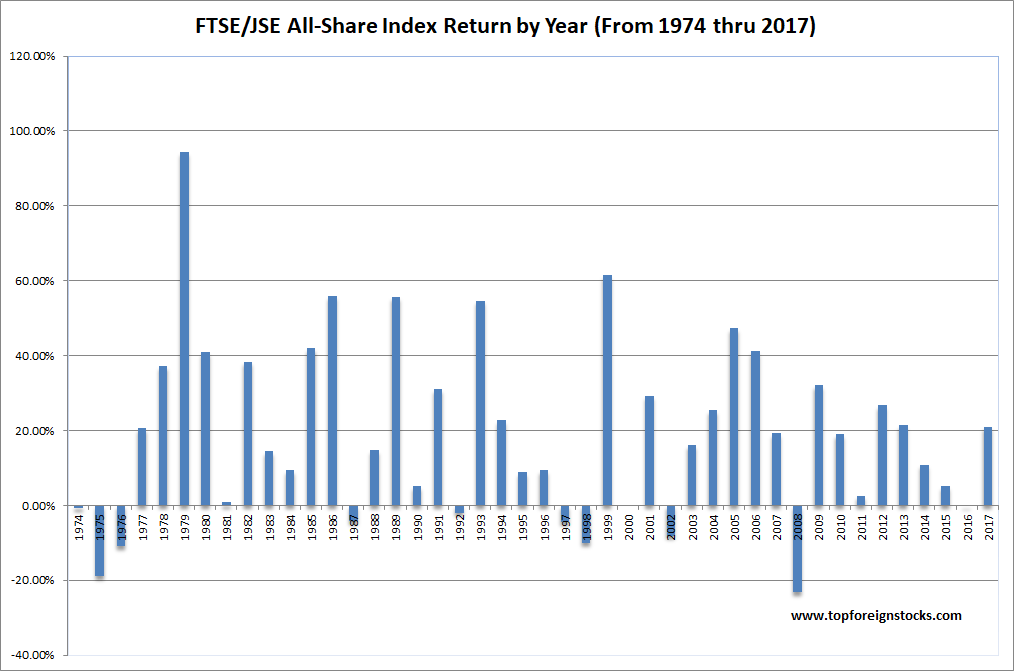
The FTSE/JSE All-Share Index Returns By Year from 1974 thru 2017 are shown in the chart below:
Click to enlarge
The table below lists the FTSE/JSE All-Share Index Returns By Year from 1974 thru 2016:
| Year | JSE All Share Index Return |
|---|---|
| 1974 | -0.8% |
| 1975 | -18.9% |
| 1976 | -10.9% |
| 1977 | 20.6% |
| 1978 | 37.2% |
| 1979 | 94.4% |
| 1980 | 40.9% |
| 1981 | 0.8% |
| 1982 | 38.4% |
| 1983 | 14.4% |
| 1984 | 9.4% |
| 1985 | 42.0% |
| 1986 | 55.9% |
| 1987 | -4.3% |
| 1988 | 14.8% |
| 1989 | 55.7% |
| 1990 | 5.1% |
| 1991 | 31.1% |
| 1992 | -2.0% |
| 1993 | 54.7% |
| 1994 | 22.7% |
| 1995 | 8.8% |
| 1996 | 9.4% |
| 1997 | -4.5% |
| 1998 | -10.0% |
| 1999 | 61.4% |
| 2000 | 0.0% |
| 2001 | 29.3% |
| 2002 | -8.1% |
| 2003 | 16.1% |
| 2004 | 25.4% |
| 2005 | 47.3% |
| 2006 | 41.2% |
| 2007 | 19.2% |
| 2008 | -23.2% |
| 2009 | 32.1% |
| 2010 | 19.0% |
| 2011 | 2.6% |
| 2012 | 26.7% |
| 2013 | 21.4% |
| 2014 | 10.9% |
| 2015 | 5.1% |
| 2016 | -0.0% |
| 2017 | 21% |
Source: Allan Gray
Download Data:
- FTSE/JSE All-Share Index Returns By Year from 1974 thru 2017 (in Excel)
- FACTSHEET – FTSE/JSE All-Share Index Jan 2018 (in pdf)
- Monthly Closing Values of FTSE JSE All Share Index 2002 Thru 2017 (in Excel)
Related ETF:
- iShares MSCI South Africa Index (EZA)
Related Links:
- FTSE/JSE Africa All Share Index – Realtime Chart (Bloomberg)
- FTSE/JSE Africa All Share Index – Realtime Chart (FT)
Related:
- The Components of the South Africa FTSE All Share Index
- The Complete List of South African ADRs
- South Africa FTSE/JSE All Share Index: Historical Total Returns Chart
- The Complete List of Listed Companies on the Johannesburg Stock Exchange
Disclosure: No Positions


Please can l have the absolute All Share index figures for South Africa? Thanks for your kind response. (1980-2015)
Richard
You can download that data in Excel in this post. Just click the FTSE/JSE All-Share Index Returns By Year from 1974 thru 2015 (in Excel) link in “Download Data” section above.
Hope this helps.
-David
Hi
Are these the nominal returns for the JSE/FTSE all share index? Also are they just the returns of the index without any dividend yield?
Thanks for your response
Yes. They are all returns of the index excluding dividend yields. Thx.
David,
I just came across this article today saying that the returns for the Alsi posted here are total returns, capital growth plus dividends http://www.standardbank.co.za/site/2013/dm2013/148004_2.html
?
Darryn
I stand corrected. The Standard Bank data is correct also. It is total returns which includes dividends. Please see this link also:
https://topforeignstocks.com/2010/11/27/south-africa-ftsejse-all-share-index-historical-total-returns-chart/
Thanks
-David
HELLO,
please can i get computed data on market risk premium
that is the differene between JSE_ALSI and Treasury 91-days bill
Thanks
Hi
Unfortunately I do not have that information. Please do some search online.
-David