I came across the below infographic on US inflation since the 1960s. Last year when inflation started creeping up the Fed said repeatedly it was only “transitory”. Now it has become permanent and they are unable to get it under control. Raising interest rates a little bit is not going to help. With sky high gas prices it may not be shock if we end up with a recession.
Click to enlarge
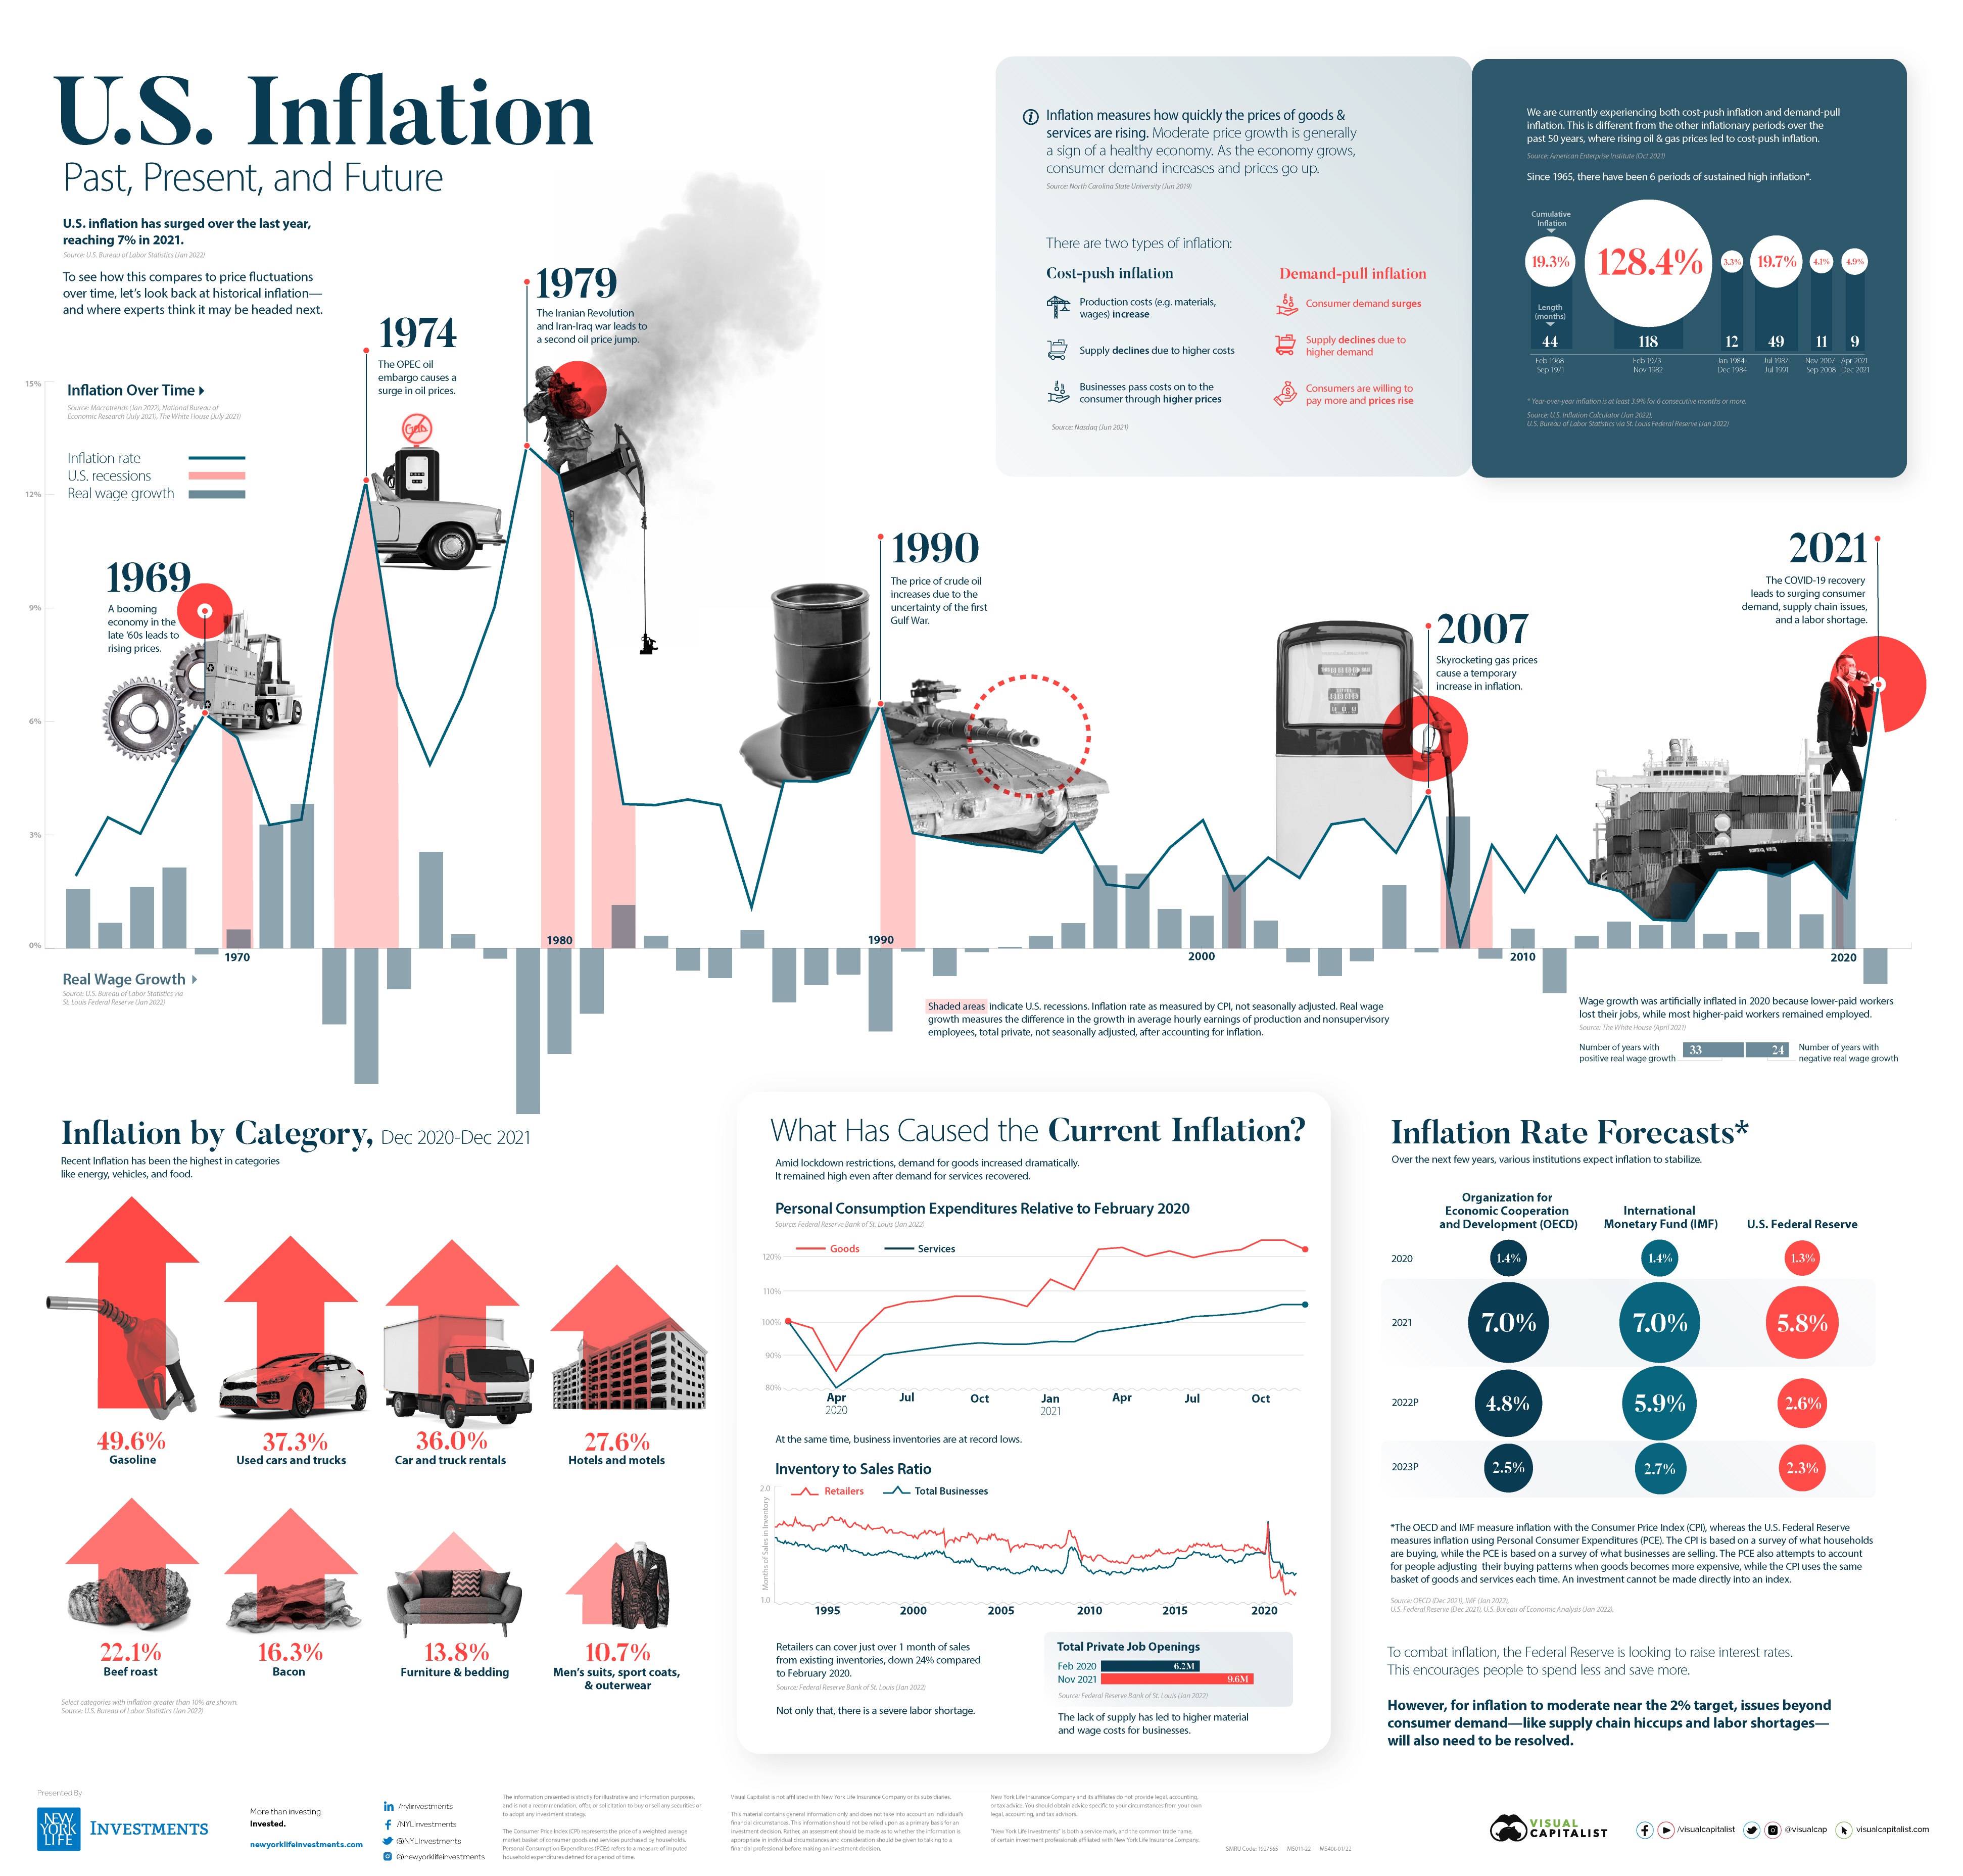
Source: Visual Capitalist