The Mercer Periodic Table of Annual Investment Returns for New Zealand Equity Markets from 2012 to 2021 is shown in the chart below. This is similar to the Australian version of this chart we reviewed a few weeks ago.
Click to enlarge
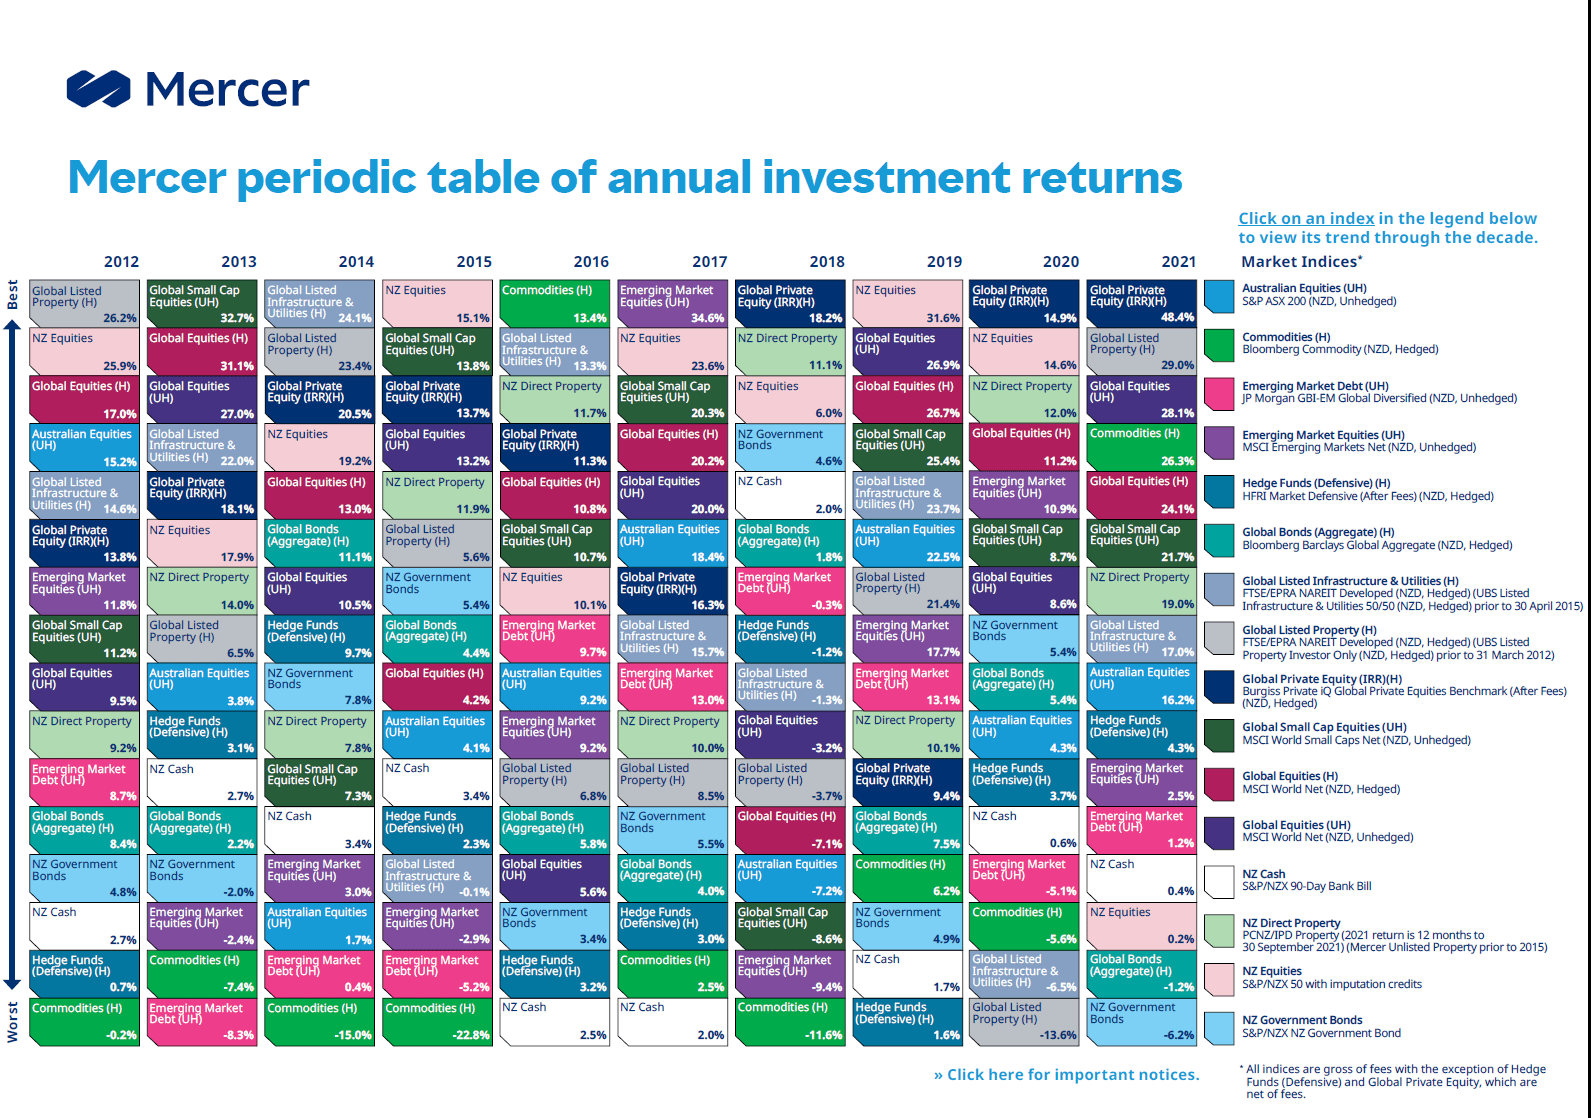
Source: Mercer
An interactive version of the above chart and other valuable charts can be found at their site here.
Related ETF:
- iShares MSCI New Zealand ETF(ENZL)
Disclosure: No positions