Why Investing in Auto Stocks is Complex

The global automotive industry is one of the complex industries for investors to analyze and seek investment opportunities. This is because the industry is subject to various forces that are unique to the industry such as political protectionism, fierce competition, labor issues, etc. In addition, earnings are highly cyclical and returns decline over time. In this post let us take us a quick of some of the major issues related to this industry based on a research report by AllianceBernstein.

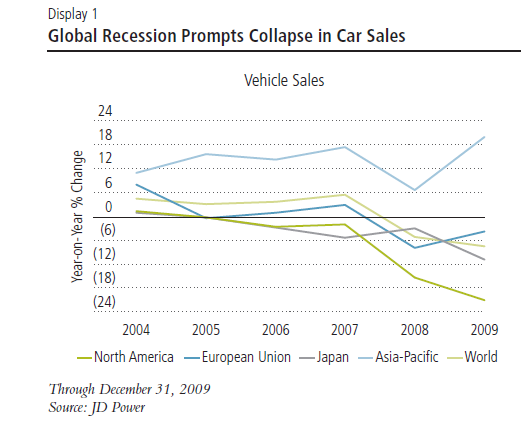
1. In developed markets car sales is declining. How many cars people buy have a direct impact on the earnings and stock prices of auto makers. When auto sales volume declines investors have to dig deeper in order to understand the timing and scope of recovery for this sector.

Click to enlarge

1-car-sales.png

2. Labor unions in developed markets are powerful and demand lavish benefits and wages. Especially in the U.S., unions keep wages high for workers making American automakers uncompetitive in the global marketplace.

2-union-wages.png

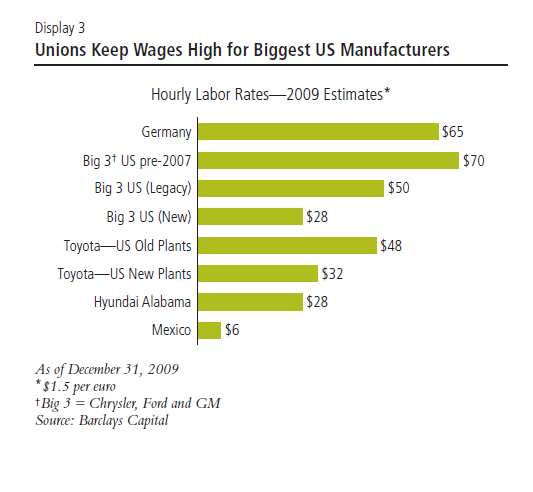
In spite of the recent bankruptcy and subsequent revival of GM(GM), wages and legacy benefits are a major cost for American automakers.

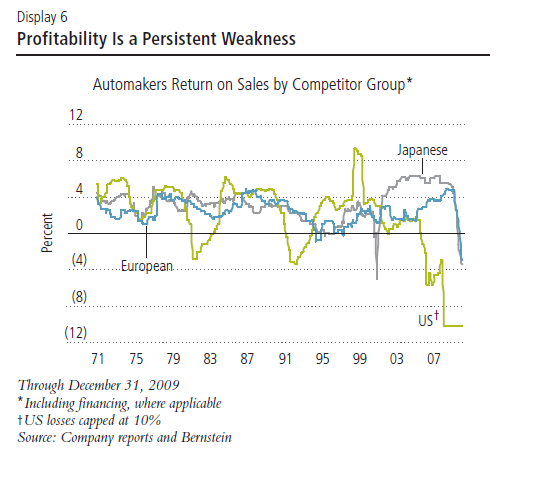
3. From an investment standpoint, the auto industry is one of the least profitable due to intense competition, large fixed-capital costs, cyclical swings hurt profitability, etc. As a result, the return on sales is just 2% on average across the industry.

3-profitability-weakness.png

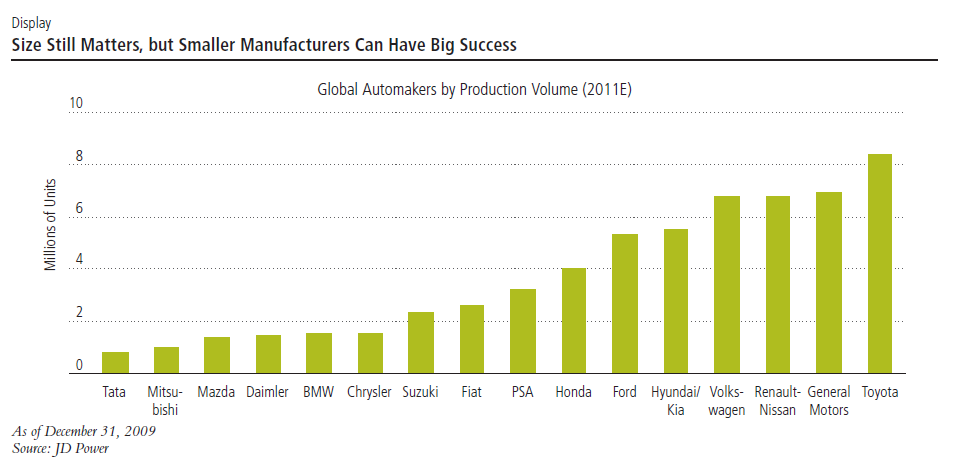
4. Size still matters in the auto industry. The largest automakers make and sell millions of units annually. However size alone does not guarantee success. For example, GM failed in 2009 and Toyota’s reputation was tarnished with recalls in early 2010. R&D is probably the biggest driver of scale in today’s auto industry.

4-top-auto-makers.png

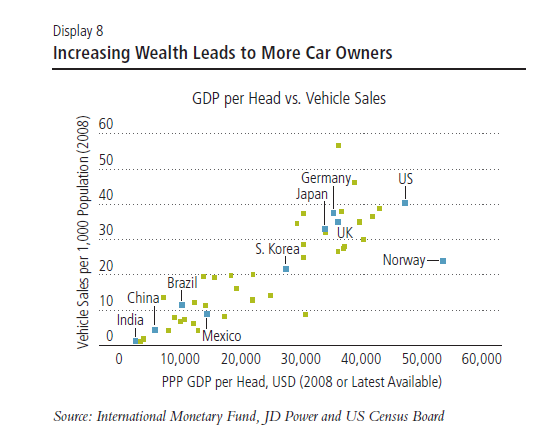
5.  There is a direct correlation between wealth and auto consumption. Car sales in an economy usually take off once a GDP per capita of about $5,000 is reached. Hence emerging markets such as Brazil, China, India, etc. are experiencing exponential growth in auto sales as their GDP capita is increasing.

5-em-car-sales.png

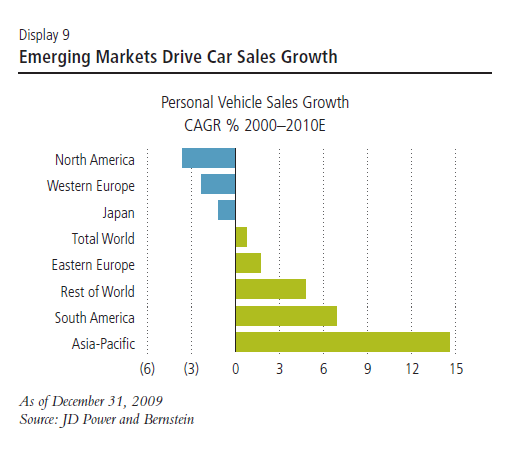
6. In the past 10 years, growth in the emerging markets has accounted for most of the increase in global vehicle sales. Sales in the developed markets of US, Europe and Japan declined as shown in the chart below. However this does not mean emerging market sales will drive automakers’ earnings higher in the coming years. Countries such as China give preferential treatment to domestic auto companies thus adversely affecting western automakers trying to take advantage of the booming auto market there. In India, domestic automaker Tata makes the $2,000 Nano beating the competition on price. Ford (F) lags behind other foreign car companies in capturing a larger share of the Indian market.

6-em-car-sales-growth.png

Source: Wheels of Fortune?, A Guide to the Global Auto Industry for Equity Investors, AllianceBernstein

Based on some of the points discussed above we can be conclude that investment in auto stocks is complex and that selecting winning companies require a deep fundamental analysis of the industry, individual companies, the direction of the economy and other factors. Some of the foreign auto companies that trade as ADRs in the U.S. market are Volvo (VOLVY), Toyota (TM), Tata Motors (TTM), Honda Morots (HMC), Daimler (DDAIY), Fiat (FIATY), Nissan Motor (NSANY), Peugeot Citreon (PEUGY) and Volkswagen (VLKAY). Due to rising gas prices and environmental awareness, consumers worldwide are increasingly attracted to smaller and fuel-efficient vehicles. Hence auto-makers that focus and excel in this space stand to perform well. Japanese automaker Nissan, French automaker Peugoet Citreon and Fiat, the Italian automaker are well positioned to benefit from the demand for small and fuel-efficient cars.

Disclosure: No positions

Why U.S. Companies Should Raise Their Dividend Payments

U.S. companies are hoarding almost $1 Trillion in cash and cash equivalents in their balance sheets according to a Bloomberg report. Despite the sluggish economic recovery companies are fearful of putting this money to work.

The S&P states: “The second quarter of 2010 marked the sixth straight quarter of record cash levels, amounting to $842 billion for companies in the S&P 500 Industrials index (which excludes financial, transportation, and utility issues).” U.S. companies are earning record-high profits in recent quarters as a result of many of the cost-cutting efforts deployed after the credit crisis and the massive layoffs.

The chart below shows the growth of cash and cash equivalents of the S&P Index companies since 2000:

Click to enlarge

sp500-cash.png

Source: Dividend Yield: The Implications of Cash Sitting on Balance Sheets, The Brandes Institute

This is not the first time that U.S. companies are hoarding huge amounts of cash. According to an article by Barry Riholtz back in July, corporate cash been piling up since 1982. From the article:

“The average cash-to-assets ratio for corporations more than doubled from 1980 to 2004. The increase was from 10.5% to 24% over that 24 year period. That was the findings of a 2006 study by professors Thomas W. Bates and Kathleen M. Kahle (University of Arizona) and René M. Stulz (Ohio State). When looking for an explanation, the professors found that the biggest was an increase in risk.

Indeed, the phenomena of corporate cash piling up has been going on for a long long time. You can date it back to the beginning of the great bull market in 1982 to 86, went sideways til the end of the 1990 recession. It has been straight up since then, peaking with the Real Estate market in 2006. The financial crisis caused a major drop in the amount of accumulated cash, but it has since resumed its upwards climb.

This FT chart makes it readily apparent that this is not a new trend: ”

us-corporate-cash-growth.png

Source: FT

Among the various sectors, S&P research showed that companies in the IT, oil, and health care industries have accumulated especially huge amounts of cash in recent months.For example, by mid-year Apple Computer (AAPL) and Google (GOOG) had $24 billion and $30 billion, respectively. In the oil sector, industry giant ExxonMobil (XOM) had $13.3 billion in cash and cash equivalents. Some of the other firms with huge cash hoardings include GE(GE), Microsoft (MSFT), Cisco(CSCO), Johnson & Johnson(JNJ), Verizon(VZ), Altria(MO), Disney(DIS), Oracle(ORCL),etc.

What do companies do with excess cash?

Some of the options available for companies to to deploy excess cash are increase dividend payments, acquire other firms, buyback own shares, reinvest in operations or simply retain the cash in the form of cash or short-term marketable securities.

Increasing dividends is one of the simplest ways companies can spend their excess cash that is advantageous to shareholders. The current dividend yield on the S&P 500 is about 2%. This is much lower than many other developed markets. Countries such as UK, Australia, New Zealand, France, Italy, Spain, etc. traditionally have much higher dividend yields. For example, Australia has a dividend yield of about 4%.

In recent months many companies such as Nike, Intel, Baxter, UPS, Johnson Controls, etc. have announced dividend raises. But despite this increase, U.S. companies have lower dividend yields. The following table consisting of randomly selected stocks shows that the majority of firms across a range of industries have yields of less than 5%:

[TABLE=755]

In addition, even though companies are sitting on mountains of cash, the payout ratio of S&P 500 is still lower than the average for the past 10 years as as shown in the graph below:

Click to enlarge

sp500-dividend-payouts.png

Source: Dividend Yield: The Implications of Cash Sitting on Balance Sheets, The Brandes Institute

Many foreign companies have much higher payout ratios sometimes exceeding 40%.

Since U.S. companies have the cash and the capacity to raise dividends they should raise dividend payouts significantly now. Increasing dividends would also put them on par with their foreign peers. Some may say that taxes may increase on dividends in 2011 if Congress does not extend the current low rates on them. However even if higher taxes are levied on dividends it is beneficial for investors to earn higher dividends if companies are unable to use them productively and investors would be able to use the cash as they wish.

Large piles of cash on their books makes some companies spend them in ways that negatively impact shareholders such as when companies overpay for their acquisition targets, hand out more in executive compensation, etc. Case in point: Amazon recently bought diapers.com paying $500 million in cash and assuming $50 million in debt.

Another way that companies spend their excess cash is buyback their shares. European companies rarely implement share buybacks. American companies tend to follow this option often since it is easy to impact share prices in the short-term without much effort. This strategy has been proven in many studies to be detrimental to shareholders. In fact companies that authorize buybacks do not know how to deploy their cash efficiently and simply decide to buy back shares. One of the arguments supporting this idea is that they consider their shares to be cheap. Usually when a buyback program is implemented, it gives a short-term pop to stock prices. When that happens, executives tend to exercise their options and sell shares. Only in some cases do share buybacks reduces the float. When companies approve share buybacks some investors consider that to be an indication that the management of the firm is incompetent since they do not know how to grow the company such as doing an M&A deal, investing in R&D, etc.

Companies also buy back shares to help offset the dilutive effects of expiring stock options. A study by S&P found that of the 214 companies in the S&P 500 that did buybacks in the fourth quarter of 2009, just 50 actually resulted in share-count reduction. This indicates that the rest engaged in buybacks just to match them with expiring options.

From an article in Bloomberg BusinessWeek on share buybacks:

“Yet for all its success, perhaps the ripest investment opportunity IBM sees is its own stock. The Armonk (N.Y.)-based company announced on Oct. 26 that it plans to buy back an additional $10 billion of its shares—and has said it plans to spend about $50 billion on buybacks in the next five years. Since taking over as chief executive officer in 2002, Samuel J. Palmisano has spent more than $68 billion on buybacks, about 38 percent of IBM’s current market value. Over that time, only ExxonMobil (XOM) and Microsoft (MSFT) have bought more of their own stock. IBM has 1.24 billion shares outstanding, down from 1.72 billion at the beginning of 2003.”

Many investors would agree that spending $50 billion of shareholder’s equity on buybacks is not a good strategy.

The article further added:

“One objection to buybacks is that companies may overpay, with cash that might be deployed more strategically. From 1986 through 2002, General Motors spent $20 billion on buybacks with money that should have gone to shoring up its finances, says William Lazonick, director of the Center for Industrial Competitiveness at the University of Massachusetts Lowell. In the past decade, Microsoft spent more than $103 billion on buybacks; its stock trades at about half its 2000 high. “A lot of companies are just stupid about buybacks,” says Niles. “There should only be one reason you buy back shares: You think they’re going up.”

At $143.84 on Nov. 2, IBM stock was up nearly 10 percent for the year to an all-time high. Still, David Trainer of New Constructs, a Brentwood (Tenn.) investment research firm, thinks it is undervalued. IBM has steadily raised profits to more than $10 a share, from $3.07 a share in 2002. It has said it aims for operating earnings of $20 a share by 2015. Yet the stock is “trading as if the company’s profits will stay the same forever,” says Trainer, who bases his analysis on IBM’s book value and cost of capital. “Buying back stock is management’s way of signaling to shareholders that the stock is cheap.” Mike Fay, an IBM spokesman, declined to comment.

Some would like to see IBM use the buyback money on dividends. “The profit is the shareholders’ money,” says Eddy Elfenbein, who runs the blog CrossingWallStreet.com. IBM’s 1.81 percent dividend yield trails the S&P 500 average of 1.92 percent. Microsoft yields 2.34 percent; Intel (INTC), 3.10 percent. “With yields at historic lows and CDs paying nothing,” says Joshua Scheinker, a senior vice-president with Janney Montgomery Scott in Baltimore, “everyone wants to see an income stream.” Scheinker notes that dividends are taxable—and that the levy may rise if Congress does not extend the Bush tax cuts.”

It is true that many of the companies that have excess cash such as IBM carry debt on their books. They can use the excess cash to pay down debt. But companies seem to have decided not to pay down debt now since they can use the cash to reinvest in their operations or they simply want to hold onto cash for now until the economy recovers.

In conclusion, for the reasons discussed above US stocks will become more attractive to investors if they increase their dividend payments further from current levels.

25 European Companies with High Emerging Market Exposure

Some investors are completely avoiding European stocks due to the current Irish debt crisis. However they be missing on some excellent investment opportunities. There are many European  multinationals with strong presence in foreign countries especially in the fast-growing emerging markets(EM). In fact, European multinationals derive more than 10% of their revenue from EM compared to just 7% for American multinationals. This is because many European multinationals have the “first-mover” advantage in capturing foreign markets due to their centuries-old presence there due to colonialism when great European powers ruled most the world. For example, long before Coco Cola(KO), Starbucks (SBUX) arrived in Asia, banking groups such as HSBC and Standard Chartered operated banking centers in many Asian countries.

HSBC(HBC) did a comprehensive study on European companies for their foreign earnings. Their study found that Spanish firms have the largest exposure to EM mainly due to their strong foothold in Latin American markets. The chart below shows the exposure to EM relative to developed markets by country:

European-Countries-EM-DEV-Exposure

The chart below shows the top 25 European companies with the highest exposure to EM:

Click to enlarge

European-Companies-EM-Exposure

Source: via FT Beyondbrics blog

UK-based Standard Chartered Bank has the largest exposure to EM. It trades on the LSE with ticker STAN. Spanish banks Banco Santander(SAN) and Banco Bilbao Vizcaya Argentaria SA(BBVA) currently have dividend yields of over 7% and 4% respectively. Investors who would like to add some EM exposure to their portfolio they are good picks at current or lower prices. Telecom services operator Telefonica (TEF) has a 8.04% yield. In addition to growing infrastructure spending, private consumption of goods and services is rising in EM markets as the new middle-class acquires consumer goods to raise their standard of living. Anglo-Dutch consumer goods giant Unilever (UN) mentioned in the list has a multitude of brands which enjoy a high popularity in developing countries. Switzerland-based ABB(ABB) is heavily involved in the infrastructure buildup in emerging markets such as India, Brazil, China, etc.

Chart: Historical Investment Returns from 1995 to 2009

The chart below shows the historical investment returns for various indices from 1995 thru 2009:

Click to enlarge

Historical-Stock-Returns-Chart-1995-2009

Some observations:

  • Since 2003, the MSCI Emerging Markets Index has yielded double-digit returns except in 2008 when it fell 53%.
  • On 15-year annualized returns basis, the small-cap Russell 2000 Index and the REIT Index have performed better than S&P 500 and the emerging market indices.
  • The MSCI EAFE Index performed better than S&P 500 in the past few years except in 2008 when it was the second worst performer.

Related:
The Callan Periodic Table of Investment Returns 2009

South Africa FTSE/JSE All Share Index: Historical Total Returns Chart

The chart below shows the year total return of the South Africa FTSE/JSE All Share Index from 1926 to 2009:

Click to enlarge

Source: Alphen Asset Management, South Africa

In 2008, the index was down over 30% but up over 40% last year. Since 2000, the index made gains in all years except 2002 and 2008. Riding the commodity bull run, South Africa’s main stock index rose over 40% in 2001, 2009 and over 50% in 2005 and 2006.

You may also like:

  1. South Africa’s FTSE/JSE All-Share Index Returns By Year 
  2. A Review FTSE/JSE All-Share Index of South Africa (TFS, Mar 2014)
  3. JSE All Share Index, SA Shares
  4. Graphic: 50 years of the FTSE All-Share index, The Telegraph
  5. Monthly Closing Values of FTSE JSE All Share Index 2002 Thru 2017 (in Excel)

Related Articles:

  1. JSE Stock Return Chart (JSE Site)
  2. Don’t look back in anger – Assessing market returns over the last 10 years, Investec

Related ETF:

  • iShares MSCI South Africa Index Fund (EZA)

Update (Feb 21, 2021):

1)The evolution of South Africa from Frontier market to Emerging Market:

Click to enlarge

Johannesburg Stock Exchange Growth

Source: The Path to Becoming an Emerging Market, AB Blog

2) JSE All Share Index-Major Events in 2016:

Source: Cannon Asset Managers

3)FTSE/JSE All Share Index TR: monthly from July 1995 to March 2020 (log scale):

 FTSE/JSE All Share Index TR:  subsequent performance after bear markets:

Source: 5 REASONS FOR CLIENTS TO STAY INVESTED, Analytics

Related:

Disclosure: No Positions